Key Considerations to Help Determine Optimum NPSH Margin - Part 2
By Allan R. Budris
This is the second part of a two part column on this subject. The first part (WaterWorld, December 2012) introduced the issues of pump Cavitation, NPSH Margin and Reliability, along with the writer's concept of pump "Suction Energy." Suction Energy is reasonably good at determining when a pump will, or will not, be damaged from cavitation. This Part 2 column further expands and supports these issues, in addition to including the writer's specific NPSH Margin recommendations for optimum total pump life cycle cost.
NPSH Margin
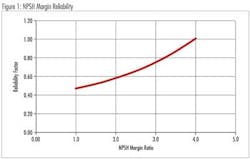
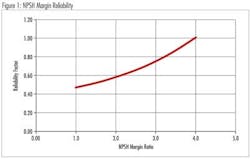
Not only was the writer able to identify a relationship between pump Suction Energy and Reliability (as shown in Part 1) but the writer also found a relationship between pump Reliability and NPSH Margin Ratio (based on the same factory field repair data), which is shown in Figure 1. As can be seen, there is a definite trend of greater pump reliability with increasing values of NPSH Margin Ratio (NPSHA/NPSHR), culminating with the maximum reliability at an NPSH Margin Ratio value of 4.0, which is about where cavitation starts in the typical pump.
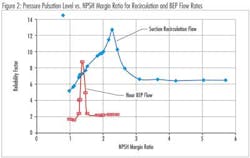
To further validate this NPSH Margin vs. Reliability relationship, controlled factory tests on high suction energy pumps where conducted, where discharge pressure pulsations were measured (as an indication of reliability), and plotted against the corresponding NPSH Margin Ratios (see Figure 2). As can be seen, the results do not show the straight line relationship depicted in Figure 1 due to the small air content in the water. The pressure pulsations do initially increase with reducing NPSH Margin Ratios, but then peak at an NPSH Margin Ratio of around 1.4 near the pump BEP (or POR), and 2.3 in the low flow suction recirculation region (below the AOR). The reason that the pressure pulsations first increase as the NPSH Margin Ratio is reduced, and then at some point actually decreases, is because enough dissolved air eventually comes out of solution during the creation of the cavitation bubbles to cushion the bubble collapse when the fluid reaches higher pressures within the pump impeller.
The very high pressure pulsations shown for the suction recirculation plot in Figure 2 demonstrate why "High," and especially "Very High" suction energy pumps should not be operated in suction recirculation for any extended period of time. However, if such operation is unavoidable, the minimum NPSH Margin under these conditions should be at least 3.0.
Another factor to consider when establishing the desired NPSH Margin for a pump, is that the actual field NPSH Margin may differ from the original calculated value due to an assortment of uncertainties, such as:
- The accuracy of the initial pump NPSHR test (even an NPSHR test performed to Hydraulic Institute standards has a tolerance)
- Any pump wear, such as increased wearing ring clearance
- Any flow disturbance from the inlet pump piping
- The air content of the liquid
- The liquid temperature
NPSH Margin Impact on Pump Reliability
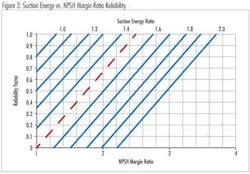
As demonstrated in Part 1 and the above text, both pump Suction Energy and NPSH Margin impact the overall reliability of a centrifugal pump, although there is an interaction. Using the previously mentioned industrial plant pump repair study, the writer was able to combine these two affects into a single pump reliability plot, which is shown in Figure 3. The "Suction Energy Ratio" is defined as the "Application Suction Energy" value divided by the "Start of High Suction Energy, pump type" gating value (from the December Part 1 column). A reliability of 1.0 represents a pump life (MFBF) of 4 years or more. This includes not only the cavitation erosion of the impeller but also the reduced life of the pump bearings and mechanical seal from cavitation initiated vibration.
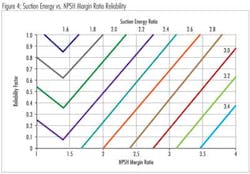
As an alternative, the above laboratory NPSH Margin Ratio vs. Pressure Pulsation results were coupled with some more recent impeller cavitation damage data to develop a second "Suction Energy Ratio" vs. "NPSH Margin Ratio" Reliability graph (see Figure 4) for Very High Suction Energy pumps, handling warm water, and operating in the AOR. This graph is primarily an indicator of the cavitation erosion life of the impeller.
Conclusions
The writer's specific NPSH Margin recommendations for a "Best-of-Class" pump user who wants to minimize total (life time) pump costs are as follows:
- Calculate the "Suction Energy" for the application, and compare it to the gating values shown in Part 1 of the column.
- If the application has Low Suction Energy (Part 1), with no abrasives or corrosives, then the NPSH Margin Ratio only has to insure that little or no head is lost from cavitation. Typically a minimum NPSH Margin Ratio of from 1.0 to 1.3 should be sufficient under these conditions.
- If the application has High, but not Very High, Suction Energy (Part 1), then the user should next look for any mitigating issues, such as materials of construction, entrained air or gas, and/or liquid thermodynamic factors. If mitigating factors do exist, operation with minimum NPSH Margin Ratios of 1.1 to 1.5 may be sufficient within the AOR. However, for cold or warm water applications, the minimum NPSH Margin Ratio should be in the range of 1.5 to 2.0 within the AOR.
- If the application has "Very High" Suction Energy (Part 1), the minimum NPSH Margin Ratio should probably be at least 2.0 to 2.5 within the AOR. Or as an alternative, consider the pump reliability predictions from Figure 3 (for overall reliability including bearings and seal) or Figure 4 (for impeller erosion life). These figures are probably most accurate when used to compare various pump options.
- Finally, the best way to increase the NPSH Margin for a pump application is generally to reduce the pump speed by including a VFD, which will not only improve the pump reliability from cavitation and other speed-related factors (see WaterWorld, April 2008, where a 50% speed reduction was shown to improve pump life by 75%) but it will also increase the pump system efficiency, and therefore have a major impact on minimizing "Total Life Cycle Cost."
Click here to read Part 1: Key Considerations to help Determine the Optimum NPSH Margin for Centrifugal Pump Applications >
