Back to Basics: Pump Factory Performance Tests

Feb. 3, 2014
In order to insure that a pump’s performance matches the system requirements, both the pump and system head/pressure and flow rate performances must meet expectations. With that, factory pump performance is available in several forms, each with varying degrees of accuracy.

By Allan R. Budris, P.E.

INTRODUCTION

This column addresses the issues related to the accuracy of the performance curves provided by the pump manufacturer. Factory pump performance is available in several forms, each with varying degrees of accuracy. The least accurate manufacturer performance document being the published (pricebook) performance curves, with the most accurate (and most expensive) being a customer-witnessed factory test of the specific pump in question, tested in accordance with the Hydraulic Institute (HI) test standard. It should be noted that even a witnessed test will have a tolerance on the accuracy due to the collective gauge inaccuracies and pressure/flow fluctuations. This is in addition to the tolerance on how closely the specific pump impeller trim performance matches the target service head-capacity condition point.

FACTORY PUMP PERFORMANCE TEST

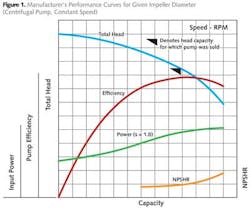
Factory pump performance tests (see Fig. 1) are typically conducted in accordance with the Hydraulic Institute Test Standard (ANSI/HI 14.6 "Rotodynamic Pumps for Performance Acceptance Tests," 2011). This standard is intended to demonstrate hydraulic performance (head, input power and efficiency vs. capacity) and mechanical integrity, plus additional tests for hydrostatic pressure rating, net positive suction head required (NPSHR) and priming time. It covers both centrifugal and vertical pumps and has six tolerance and acceptance grades. It should be noted that pump pressure is expressed in terms of total head (in feet/meters of liquid) developed by the pump. Total pump head is the algebraic difference between the total discharge head and the total suction head, with each of these individual total heads being the algebraic sum of the static pressure head, velocity head and elevation head. By using head and not pressure, the head-capacity performance then becomes independent of the specific gravity of the liquid. The specific gravity of the liquid does, however, have to be considered for the pump input power (brake horsepower) measurement. Published manufacturer's performance curves are based on cold water as the liquid.

This HI test standard further specifies the allowable performance and test instrument accuracy tolerances. Performance tolerance can be all positive or +/- and can differ based on the pump head and flow. The performance tolerance grade must be specified unless the default grade is acceptable. Accuracy tolerances are established for the acceptable pulsation-caused fluctuations of the test readings (+/-), and the accuracy of the instruments, given in +/- values. The standard also covers recommended instrument calibration intervals and test setups, plus required straight pipe lengths that follow fittings which precede the flow and pressure gauges. These requirements make it difficult to apply this HI/ANSI standard to pump field testing.

Factory tests of the specific pump insure that the impeller diameter is trimmed, plus other pump modifications are made to insure that the required performance is achieved (at least within the allowable test tolerances). Witness testing should insure that all key HI/ANSI test requirements are followed during the test (see "Pump Performance Curve Shapes and How to Modify Them," January 2011.)

More Pump Tips

Do you enjoy Allan Budris's monthly Pump Tips column? Here are a few of his recent articles:

Back to Basics: Pump Factory Performance Tests

Selecting the Optimum Pump Control Valve to Save Substantial Wasted Energy Dollars

Back to Basics: How to Improve Vertical Turbine Pump Reliability through Optimum Bearing Selection

Pump Protection: The Pros and Cons of Various Centrifugal Pump Casing Types

Considerations for Designing Piping Adjacent to a Centrifugal Pump

Bearing Burdens: Reducing Lubrication Contaminants to Improve Bearing Life, Lifecycle Costs

Power Precautions: Analyzing Pump Startup and Shutdown Best Practices

PUBLISHED PUMP PERFORMANCE

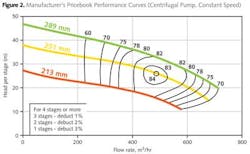
Factory pricebook curves (see Fig. 2) are normally developed following the same HI/ANSI test standards but on an early production unit. As a result, published (pricebook) factory pump performance curves will likely differ from the specific pump performance due to impeller and casing manufacturing (geometry) tolerances. These manufacturing tolerance variations include the wearing ring clearances, cast impeller vane shapes, volute throat area, and surface finishes. Some of these variations are impacted by pattern wear, which takes place over time. So unless the specific pump was factory tested, some additional performance variation would be expected.

In my experience, actual published pump efficiencies may fall about two percentage points (or more for some smaller standard pumps) below the pricebook values but can normally be recovered through some of the pump modifications referenced above, which are carried out during the specific pump performance tests.

Typical pricebook performance curves are normally presented for constant speed and with the impeller trims offered, as shown in Figure 2. The performance changes for the various impeller trims follow the below "affinity laws," assuming no change in efficiency. However, the increasing mismatch between the impeller and casing with successive impeller trims causes the efficiency to drop. This means that these affinity laws should only be used for impeller trims of about 5 percent. Otherwise, one should refer to the pricebook curve.

Affinity Laws (Impeller Diameter Change)
Q2 = Q1 * (D2 / D1)
H2 = H1 * (D2 / D1)2
BHP2 = BHP1 * (D2 / D1)3

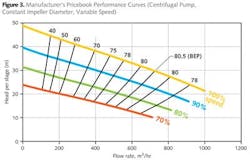
Constant impeller diameter, variable pump speed factory curves (see Fig. 3) can also be provided for variable speed applications. They follow the following set of affinity laws.

Affinity Laws (Speed Change)
Q2 = Q1 * (N2 / N1)
H2 = H1 * (N2 / N1)2
BHP2 = BHP1 * (N2 / N1)3
Where:
Q is the flow rate
D is the impeller outer diameter
H is the total head
BHP is the brake horse power
N is the pump speed

CONCLUSIONS

There are many performance-related issues to consider when evaluating and selecting a centrifugal pump for an application, not the least of which is the type of factory performance curve to use (pricebook, factory test of the specific pump, or witnessed factory test of the specific pump). This decision impacts the expected tolerance/accuracy of the factory performance curve. It should further be understood that these performance tolerances are in addition to any performance variations caused by the pump inlet and/or outlet field piping (see "Pump Piping Can Impact Reliability," April 2009, for recommended minimum straight pipe lengths before and after the pump). All of these facts should be considered in order to insure the desired field performance. Finally, pump users should be careful not to over-compensate for any potential negative factory performance tolerance, as it will add excessive energy costs.

About the Author: Allan R. Budris, P.E., is an independent consulting engineer who specializes in training, failure analysis, troubleshooting, reliability, efficiency audits, and litigation support on pumps and pumping systems. He can be contacted via email at [email protected].

Sponsored Recommendations

ArmorBlock 5000: Boost Automation Efficiency

April 25, 2024
Discover the transformative benefits of leveraging a scalable On-Machine I/O to improve flexibility, enhance reliability and streamline operations.

Rising Cyber Threats and the Impact on Risk and Resiliency Operations

April 25, 2024
The world of manufacturing is changing, and Generative AI is one of the many change agents. The 2024 State of Smart Manufacturing Report takes a deep dive into how Generative ...

State of Smart Manufacturing Report Series

April 25, 2024
The world of manufacturing is changing, and Generative AI is one of the many change agents. The 2024 State of Smart Manufacturing Report takes a deep dive into how Generative ...

SmartSights WIN-911 Alarm Notification Software Enables Faster Response

March 15, 2024
Alarm notification software enables faster response for customers, keeping production on track