International Ambition, Local Scale: How the Global Water Market is Changing
This year's 13th Water Yearbook, known as the "bible" of the water industry, confirms market predictions that the international water sector is accelerating, but on a local scale. WWi looks at key findings from the report and speaks to the global companies affected, including Veolia Environnement.
Last year's global water report published in WWi brought both good and bad news to the industry. Good in as much that a fundamental shift from east to west can be observed; more players are rising from Asia and moving westwards into the Middle East and African markets. The global water market is clearlygrowing. At the same, and here comes the bad news; growth of water and sanitation is improving around the world to such an extent that the larger water and wastewater conglomerates are struggling to maintain their "top five" position.
As WWi reported last year, the 12th edition of law firm Pinsent Masons' Water Yearbook showed the dominance of the top five firms (Suez, Veolia, SAUR, Agbar Water and RWE) starting to diminish. For example, in 1999 these firms accounted for 68% of a market, serving 350 million. Ten years later and the market grew to serve 802 million people, yet the top five only has a collective market share of 34%.
One year later and the 13th edition of the Yearbook reveals a similar picture; regional utilities are here to stay and the international model is moving to the local model.
The report attributed this again to the growth of the market: in 1999 only 5% of the world's population was served by the private water sector. This is estimated to have increased to 13% in 2011 and predicted to rise to 16% by 2015 and 21% by 2025. China, too, is partly responsible for the move, with five Chinese companies now serving more than 15 million people.
Industry response
As a result of localised players, major firms will be pushed into promoting their work on wastewater contracts, as well as drinking water contracts. The report also included data on the treatment capacity for water and wastewater of companies. Veolia Environnment came out top, treating 9.8 billion m3/year of drinking water and 7.3 billion m3/year of wastewater, totalling over 16 billion m3/year.
Defending the company's position, Michel Canet, executive vice president for major projects group, Veolia Water Solutions & Technologies, tells Water and Wastewater International magazine (WWi): "Veolia Water Solutions & Technologies has not lost market share on any of its core businesses.
For instance, we have for several years been winning a number of large desalination projects but this particular market has slowed down in the last couple of years. However it is now starting to pick up again and we are part of it. We have not lost competitiveness nor technical leadership."
Canet says the company aims to "work together with the growing presence of local companies when that is the best approach for Veolia Water Solutions & Technologies".
He cites the example of the Ministry of Electricity and Water in Kuwait who awarded a €137 Million contract to a consortium made of Veolia Water Solutions & Technologies and local construction company Alghanim International, to design, build and operate a new reverse osmosis desalination unit at Az-Zour South plant, located 80 km from Kuwait City.
On the subject of suggested renewed efforts on wastewater treatment, Canet says wastewater treatment is "nothing new for us". He says: "The difference is that now we don't just look at treating wastewater in the traditional way, we look at wastewater as a resource: we have the technologies to reuse the wastewater, recover energy from sludge and extract valuable by-products such as biopolymers."
Avoiding burnt fingers in complicated market
The top five and unstoppable growth of Asia's water sector to one side, the past year has also witnessed major political uncertainty in another major area of growth: the Middle East and North Africa (MENA). Prior to the well documented period of civil unrest, the area – particularly the North African desalination market – was looking prime for expansion and investment.
Dr David Owen, report author and managing director of consultancy Envisager, believes the Arab Spring should not have long-term impacts on Asia's development Westwards.
Speaking to WWi, he says: "Politics is one thing, water is another. And every reform needs a state supply of water and for wastewater to be managed. The underlying drivers for the Middle East and North Africa market remain unchanged. It makes sense to see these companies expanding because it's the classical Chinese model of development in a way. They start by importing expertise/importing equipment and then learn as fast as they can to become self sufficient and then export. Singapore, as a very export orientated country, doesn't have very many natural resources of its own so the idea really is to export capabilities to the rest of the world."
Since the last report the global water sector continues to attract companies investing into new subsidiaries to enter the market. One example is Korean electronics firm LG Electronics injecting over USD$400 million into a "Green Membrane Bioreactor" unit. The company's ambition is certainly a good barometer of Asian companies' ambitions for the market. By 2020 LG aims to become a top 10 global water treatment company and generate USD$7 billion in revenue.
Owen, however, warns about misguided ambition, especially in the complicated water market.
"One cautionary remark here would be one of the things I've seen in the last decade was companies moving into water without really understanding the complicated beast that it is, and getting their fingers burnt. Classically and most hilariously is Enron and Azurix and the likes of RWE. This is especially the case with power companies moving into water and then realising it's not quite what they thought it was."
Sanitation Rethink
It's difficult to discuss the global water market without crossing into humanitarian efforts. Last year's report warned that the Millennium Development Goals (MDGs) have a long way to go. These aims include to halve, by 2015, the proportion of people without sustainable access to safe drinking water and sanitation.
During the report launch, the Envisager managing director didn't pull any punches with his view on MDGs. "It's time for a new water and wastewater vision," he said. "The Millennium Development Goals have been a complete failure. It's time to stop patronizing people and time to get the job done."
Speaking to WWi he later adds: "Frankly, the MDGs are all very laudable but missing the point entirely. The idea that we just feel satisfied about halving lack of access is simply not good enough. It's either access or no access. The case for sanitation, if you move a place with 50% access to sanitation to 80% access to sanitation, that still means 20% of people are excreting in the open and their excreta continues to contaminate water resources.
"We have to go forward to a 100% target and avoid what I call "targetism" - just trying to tick boxes. The problem with sanitation is that the benefits are not so immediate. Water access is very simple – something comes out of a pipe or tap. Box ticked. In the case of sanitation a lot of the benefits are somewhat more intangible. Dignity, comfort and avoidance of disease don't come across so rapidly."
Owen further criticises the MDGs for including a definition of safe levels of sanitation which can mean "more or less a pit in a house with a cover on it". He adds that another problem with sanitation is the expression that sanitation is the "water sector's poor cousin". As a call to arms the report author asks for a "fundamental rethink about what our priority needs to be, right across the board from countries to aid agencies.
Global project report – country by country
With last year's Yearbook focusing on North and South America and the Asia Pacific region, this year the findings focus on Europe, the Middle East and Africa. As a result, WWi has selected four active markets from each region, providing detail on market evolution, active companies and drinking water/wastewater availability. The remaining countries can be found in the full copy of the Pinsent Masons 13th edition of the Yearbook available from the firm. First up is the Middle East, followed by Africa and finally Europe.
MIDDLE EAST
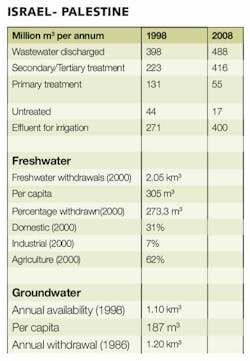
Israel remains one of the leaders in recycling wastewater. At the beginning of the 1990s, 90% of domestic and industrial users were connected to the sewerage network and 70% of the water collected was reused, accounting for 195 million m3 pa of water, or about 10% of total supply. From 1992 to 2003, the quantity of treated wastewater grew from 126 million to 332 million m3 per year. As 450 million m3 pa of wastewater is currently produced, treatment will be extended for all of these effluents. National policy calls for the gradual replacement of freshwater allocations to agriculture by reclaimed effluents.
Presently reclaimed municipal wastewater accounts for 30% of the total water supplied to agriculture.
It is estimated that by 2020 effluent use will constitute 50%. Back in 2008 a total of 30% of effluents were treated to tertiary standard. In the same year, 82% of treated effluents were used – the highest amount in the world at the time.
Fresh water in all areas of Israel will be restricted to domestic use by 2014. The increased cost of land and labour is driving the profitability of irrigation agriculture down. This is creating considerable potential for mutual aid between the two states with Palestine taking over the commodity side of food production and Israel concentrating on higher value activities such as seeds and support services.
When it comes to the West Bank and the Gaza Strip, the Palestinian Water Authority's National Water Plan highlights investment needs of USD1.5 billion in the Gaza strip and USD3.5 billion in the West Bank over the next 20 years.
Israel and Syria have extensively exploited the Jordan River basin and sources in recent years. Israel's National Water Carrier was conveying 420-450 million m3 pa in the 1980s, which, along with direct water extractions in the Upper Jordan Valley and on the shores of Lake Tiberias accounts for effectively the whole discharge of the river in its northern section. Financial and political pressures have restricted Jordan's exploitation to 120-130 million m3 pa from the Yarmouk. Israel in turn pumps some 70 million m3 pa from the Yarmouk while Syria takes between 200-250 million m3 pa from this river.
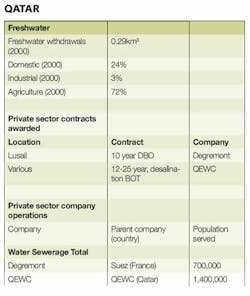
With 75mm of rainfall per annum, Qatar has no surface water resources. Agriculture is therefore almost entirely dependent on irrigation from pumped groundwater. Renewable water resources are now totally depleted. Groundwater levels are falling by 0.5-1.1m per year and the quality of water is being compromised by sea water ingress and the intrusion of saline water from deeper aquifers. At the current groundwater withdrawal rate of it is estimated that Qatar aquifers will be depleted in 20 years.
Desalination plants account for 96% of municipal potable water production. The total available potable water storage in the country, in buffer reservoirs, ground tanks, elevated tanks, and water towers, totals approximately 1.1 million m3. This represents approximately three days' supply based on an average national consumption rate.
The sector was restructured to allow private sector involvement in the 1990s. Distribution and transmission were taken over by the Qatar General Electricity and Water Corporation (QGEWC, now called Kahramaa). Generation and desalination were put under the Qatar Electricity and Water Company (QEWC). It was in 2000 that QEWC was granted the power to charge for services and to operate on a commercial basis. However, the government's current pricing policy of supplying potable water free of charge to the prime residence of all Qatari nationals may need to be reconsidered depending on the nature of private sector involvement required.
In order for the government to maintain irrigated agriculture, and in the absence of any other source of water supply, Qatar is looking to import water from Iran. This would be used to increase the remaining groundwater reserves through artificial recharge to combat and minimise the environmental impact on the deteriorating water quality caused by salt water intrusion and soil degradation.
Imported water from Iran is being negotiated and the government has commissioned a study to test the feasibility of using this water for direct irrigation purposes. It is expected that 5 m3 per second (160 million m3 pa) of water would be delivered from Iran's Karun River.
Following a decree in 2001, the Ras Laffan Power Company was formed as a joint venture between AES Corporation (USA, 55%), QEWC, Qatar Petroleum (10%), and the Gulf Investment Corporation (Kuwait, 10%). Construction of the Ras Laffan B Power and Water Plant started at Ras Laffan in June 2005 and it entered service in 2008, meeting short-term water needs.
Ras Laffan B was built by Q-Power (QEWC, 55%), International Power (UK, 40%), and Chubu Electric Power (Japan, 5%). Ras Laffan B is delivering a further 150million m3 pa of water, being sold to Kahramaa under a 25 year purchase agreement.
Ras Laffan C is currently under development and will deliver 286,000 m3 per day of water as part of an IWPP. Looking ahead, the State is seeking a further 400,000 m3 per day of water by 2016 and is considering proposals for a 409,000 m3 per day MSF facility at the Ras Abu Fontas B2 site and a 227,000 m3 per day RO facility at the Ras Laffan site.
Currently, Saudi Arabia has 24 desalination plants in operation with a 600 million gallon per day capacity, or 700,000 m3 per day. The Saline Water Conversion Corporation (SWCC) now plans to construct 17 desalination plants (with a total capacity of 2.3million m3) so as to provide a total capacity of 3.0 million m3 per day.
However, a lack of maintenance has held back the operation of these facilities and their use. For example, the Jeddah 1-4 desalination plants are meant to generate 95 million gallons per day, but operational problems means the real figure is some 65-70 million gallons per day. In addition, the water network suffers from distribution losses in the region of 40%. This in turn has been causing water table problems, and buildings in the area have not been designed to cope with this.
Another example is the Shuaiba facility, which serves the Holy City of al Makkah (Mecca). This plant has a capacity of 50 million gallons per day, but had been allocated a maintenance budget of USD0.41million pa against an operating cost of USD90 million pa (USD1.1 per m3).
The country currently uses 185 million m³ per year of treated wastewater effluent but sewerage coverage is less than 60% and the population is growing by 3% per annum. Some 8% of wastewater is fully treated. USD14billion is needed for basic services over the next 20 years in Riyadh, which includes USD9 billion in water treatment and distribution and USD4.9 billion for sewerage and sewerage treatment.
The Riyadh plans involve a six to seven year management contract, which will be superseded by a lease or concession contract. Various areas have been highlighted for these contracts, especially leakage, which currently accounts for some 1.1million m3 of water per day, equivalent to the production of nine of Saudi Arabia's leading desalination facilities. It is assumed that USD0.4 billion on network repairs in Riyadh will generate savings of USD2.1billion by 2026 in avoiding extra desalination capacity.
The individual Emirates have experienced an increase in water demand of 10 to 40 times since 1970. Part of the water shortfall for agriculture and municipal gardens is to be met through a comprehensive programme of sewage treatment and effluent recovery. While the annual recharge for groundwater in the UAE is 20 million m3, the rate of groundwater extraction has been around 880 million m3 a year.
In consequence, groundwater levels are falling by one metre every year for the past 30 years. In Dubai, water supply is currently 210,000 m3 per day and is projected to rise to 660,000 m3 per day by 2020.
Water demand for Abu Dhabi was 1.87 million m3 per day in 2003 and is forecast to rise to 3.12 million m3 per day by 2015. In 2009, total desalination capacity was 8.4 miillion m3 per day in the UAE, 13% of global capacity. At the same time, domestic water was 550 litres per capita per day and groundwater over-abstraction was forecast to account for all groundwater resources by 2060.
There's a continued emphasis towards the private sector management of water and sewerage services and the UAE envisages the positive use of water meters, cuts in subsidies and ending subsidies for expatriates. Water is currently sold at 25% below its cost price.
All of the Emirates are considering the installation of comprehensive sewerage networks and sewage treatment works so as to optimise the retention of effluents. In Abu Dhabi, the 1982 Mafraq sewage treatment works served 330,000 people. It was upgraded to handle 210,000 m3 per day by the end of 1999 and 260,000 m3 by 2001. Sharajah's Al-Awir sewage treatment works underwent an expansion from 260 to 520 m3 per day at a cost of USD54 million in 1997.
AFRICA
"Algeria - major new contracts over the past few years make it a PSP leader in MENA, but not all plain sailing as Gelsenwasser loses Ouran."
Dr David Owen, report author
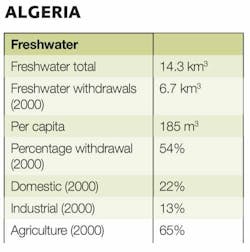
Until recently, all water and sewerage services, where provided on an organised basis, were provided by the state. Finance is currently provided by the state, along with World Bank, African Development Bank and the EIB providing project funding. A total of 92% of the urban population receives piped water but supply is intermittent, partly due to the poor condition of the networks, with distribution losses estimated at 40% in 2003. There are 54 wastewater treatment works, with a total PE of 3.7 million, but many of these are understood to be out of service. Extending sewage treatment to the rest of the population living in the 13 major cities will cost an estimated USD450 million by 2020.
Furthermore, extending water and sewerage services to the 1.1 million people living in the 75 secondary towns and cities by 2025 will cost a further USD2 billion for water and USD4billion for sewerage and sewage treatment. The National Sanitation Office in 2005 observed that current tariffs only cover 10% of operating costs and in consequence, a PSP plan has been put into action, for now concentrating on large plant BOT projects.
The Algerian Government's Agence Nationale de l'Eau Potable et Industrielle et de l'Assainissement has opened the sector to private sector finance and management. PSP will be introduced in stages, from management contracts towards full concessions, starting with Suez's 5+5 year management contract for water and wastewater services for Algiers, worth USD5-6 million pa.
The sewerage network has been expanded from 21,000 km in 1995 to 24,000 in 2000 and 41,000 km by 2010, connecting 86% of the population. It is planned to rise to 47,000 km by 2016. There were six sewage treatment facilities in 1990, against 123 in 2011, 56 of which were sewage treatment plants and 67 were lagoons. The total treatment capacity was 700 million m3 pa, against an estimated sewage effluent generation of 1,200million m3. Furthermore, 40 new sewage treatment plants are planned from 2010-14 with the aim of comprehensive sewage treatment by 2020.
"Continuing water sector reform shows that sustainable cost recovery works in a Sub-Saharan African country when a utility is well managed."
Dr David Owen, report author
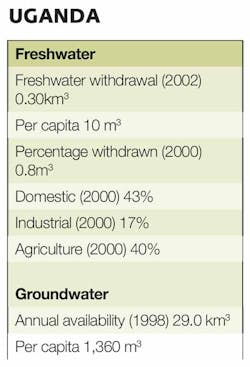
In 1987, the Ugandan Government liberalised the economy. The National Water and Sewerage Corporation (NWSC) was expected to strengthen measures for cost recovery, and become fully self-financing in its operations.
With international credit guaranteed by the Government (but lent to NWSC at commercial interest rates), NWSC rehabilitated water and sewerage systems in nine major towns. By 1997, service coverage in the area served by NWSC had improved to about 50%.
Paid for water increased from 3-5% in the mid-eighties to 30% in 1993 and levelled off at 40% for the next three years. The collection of bills ranged between 60% and 100%. In consequence, since 1993, arrears have built up by an average of some UGX5 billion pa.
By the end of March 2005, there were 112,618 metered accounts and a total of 115,873 accounts, with an average of 2,000 new connections per month, partly due to a simplified customer connection procedure.
In 2005/06 six water systems were completed, along with the construction of water systems a further 13 towns starting. Service coverage in the NWSC towns improved from 67% in June 2005 to 70% in June 2006, with UFW falling from 33.8% in 2005 to 29.3% by 2006, along with and 22,000 new water connections in 2004/05 and 28,000 in 2005/06. The total investment requirements for achieving the Water Supply and Sanitation (WSS) MDGs range from USD1.5 billion to USD1.85 billion, including 32% for small towns and 16% for large towns.
A sewerage development object was drawn up by the NWSC in 2005, which will cost EUR190 million. A suitable funding mechanism is currently being sought.
By 2008, NWSC had 202,000 customers (rising by 25,000 per annum), serving 23 towns with a total population of 4.3 million people. A total of 72% of the population of those towns were covered, generating revenues of UGX84 billion.
Management is now focussing on small scale contracts and contract performance, with individual bonus and penalty systems for managers.
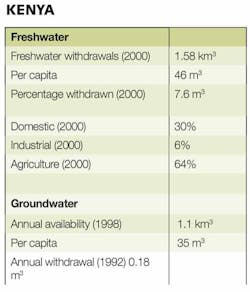
The Kenya Alliance of Resident Associations in 2007 found that while Nairobi as a whole had 74% access to mains water, 18% of the poor enjoyed household access against 86% of the non-poor. In the informal settlements, 1% of households have direct water access and 44% of households shared taps.
The other 56% spent 90-120 minutes a day obtaining their water. Nationally, tariffs had been unchanged for a decade to 2009 and are now slowly being revised. Revenues in 2008-09 covered 98% of operating costs, with unaccounted for water at an average of 49%, while 37% of connections are classified as 'dormant'.
Water vending is widespread in larger cities. Under a scheme developed in 2005, they are collaborating with official agencies in Kibera (Nairobi) and Kisumu to improve water supply service for underserved consumers. Maji Bora Kibera, an association of 500 small- scale water vendors serving approximately 500,000 Kibera inhabitants, have a partnership with the Nairobi Water and Sewerage Company.
VE and its local partner Saureca Space gained a management contract in 1999 for water services in Nairobi, involving improving basic services and reducing distribution losses. It never fully entered into service.
The 2002 Water Act, created by the Ministry of Water and Irrigation allows for concession contracts to be awarded. It also authorises the setting up of a national regulator and appeals systems. At the local level, political opposition to the presence of foreign companies has even resulted in aid funding being withdrawn.
The Water Act created the Ministry of Water and Irrigation (MWI) in 2002 to protect, harness and develop the country's water resources. A National Water Resources Management Strategy (NWRMS) was adopted in 2003. The Water Act of 2002 has made a platform for reforming the sector, which was reorganised into seven regional water boards in 2005 along with a Water Services Regulatory Board which oversees tariffs and reporting.
Matters may start to improve as the Water Services Regulatory Board has been producing annual assessments of the sector since 2008.
Egypt is characterised by limited land and water resources. Less than 3% of its area is cultivated because of water shortage. The Nile is already fully utilised, mainly for agricultural and human use. Water quality problems are mainly salinisation and water logging as a result of the over-exploitation of the Nile. These problems affect the productivity of cultivated land, while aquifers have rising salt levels and pollution ingress. Around 5.5 billion to 6.5 billion m3 per annum of wastewater is currently generated, with 2.96 billion m3 being treated and 700 million m3 of this being reused, 440 million m3 after primary treatment and 260 million m3 after secondary treatment.
Water coverage in 217 urban areas has increased from 97% in 2004 to 100% by 2008. All villages have had full water coverage since 2008. Urban sanitation coverage rose from 45% in 1993 to 56% in 2004 with the aim of comprehensive coverage by 2012. With 323 WWTWs in operation in 2008, sewage treatment capacity has increased by a factor of ten since 2000.
Coverage in 4617 villages was 4% in 2004, rising to 11% in 2008 (including work in progress) with the aim of 40% by 2012 and 100% by 2022 via a LE20 billion national plan. Unaccounted for water losses are estimated at 34%, ranging from 15-65% by region, although the lack of metering means that these figures are estimates. It is believed the real figure is in the region of 50%. Reducing leakage to 25% is seen as feasible. Water rates have been frozen since 1992, although a cost recovery operation has recently been allowed.
Since 1983, EGP30 billion has been invested in service improvement. Potable water reached 90% of the population in 2002. During this time, 1900 water treatment works were built, handling 18 million m3 per day and wastewater treatment capacity was expanded from 1 million m3 per day to 8.2 million m3 per day through the construction of 220 WWTWs. Revenues only cover 40% of costs because of subsidies, inefficiency, high levels of leakage, and non-paying state customers.
EUROPE
"France - the emergence of a new generation of smaller, local players underneath Veolia (Generale des Eaux), Suez (Lyonnaise des Eaux) and SAUR."
Since the late 1930s, PSP has generally expanded by 1% per annum. There are three leading private sector companies with 13,000 contracts, and the public sector, which addresses some 23,000 municipal contracts. The private sector accounts for 78% of the population, including the great majority of the urban population with an average population served of 3,600 people per contract. The public sector serves the remaining 22% of the population, mainly in rural areas, with an average population served of 565 people per contract.
Private sector involvement started in 1853 with the founding of Cie. Generale des Eaux (VE), followed by Eaux de Banlieue in 1867 and Lyonnaise des Eaux (Suez) in 1880. The chief domestic challenge facing both VE and Suez is the perceived lack of a competitive market, which is best demonstrated by the fact that until the Nantes sewerage concession award to VE in 1997, VE and Suez have never gained a contract from each other. The piecemeal nature of contracts in France has constrained the scope for economies of scale. VE has 2,300 contracts in France, with an average population served of 11,304, Suez has 3,000 (average 4,667), while SAUR has 6,000 contracts, each serving on average 1,083 people.
In 2008 it was announced that Eaux de Paris would not be renewing its water distribution contracts with VE and SE from the end of 2009. The actual implications are unclear as further involvement with the private sector from 2010 has not been ruled out. Likewise, VE's Ille-de-France contract serving Greater Paris (SEDIF, 4 million people) was renegotiated in 2011 on distinctly less favourable terms. A number of contracts are held jointly (e.g. Marseille, Lille & Versailles) so the country numbers used to include a significant element of double counting.
"In the UK the Northumbrian, Cambridge and Bristol deals shows that the sector's corporate make up continues to evolve."
Since 1998, there have been three announcements by the Government and Ofwat allowing greater degrees of direct competition for the provision of water and sewerage services to industrial users. In 1998, users of more than 250Ml pa were opened to competition. In 2000 this was extended to users of 100-249Ml pa and in 2002 to all users of more than 50Ml pa.
The industrial and commercial water market in England and Wales is worth GBP1.65 billion, of which, GBP1.26 billion is accessible to competition under current conditions via inset appointments and common carriage agreements. The onsite treatment of dilute industrial wastes is also open to competition, but this is a separate market with its own specialist players.
The UK continues to remain a pointer for the sector's future development. The complex nature of the relationship between the private sector and the various water entities in England & Wales, Scotland and Northern Ireland means that the UK is something of a testing bed for the private sector globally. Three new (or indeed secondary) markets emerged over a five year period. In the run up to the 1999 Periodic Review, the idea of a Water Plc outsourcing its core activities was not a pressing issue. By the time the 2004 Periodic review had been completed, it was a fact of life in the sector; either as a company outsourcing its services to others or having its services outsourced. While much of the running has been taken up by companies such as Costain and Halcrow, United Utilities, Thames, Wessex and Severn Trent among others, have all sought to enter this market.
There have been plans for an overall increase in water availability of 20 billion m³ pa by 2010, of which 3.2 billion m³ pa (16%) would come via groundwater. The shortfall for the Balearic and Canary Islands is to be tackled via new desalination plants. Demand for urban and industrial water by 2010 is expected to be 15 billion m³ pa, or 850L/day per capita. But the long-term problem areas, with a projected deficit of 6.7 billion m³ pa will remain, especially along the Mediterranean coast, Andalusia, Eastern Pyrenees, Guadalquivir, Segura and Jucar.
In comparison to most of the major western economies, Spain's sewerage and sewage treatment infrastructure remains at an undeveloped stage. The proportion of Spain's population connected to sewerage services increased from 18% in 1980 to 86% in 2000.
In 1997, Spain considered developing a water market to encourage external investment and open the market up for more PSP while restricting the role of the state. At the time, this was in response to the drought of 1995 and 1996, thus the temporary respite offered in 1997 and 1998 eased political pressure for reform.
A further drought in 1999 has concentrated minds again. In September 1999, Spain's parliamentary environment committee used fast-track procedures to approve new legislation designed to improve water conservation. The reform creates a market in water with the aim of rationalising the use of resources by allowing water rights to be bought and sold.
The law will also make obligatory the metering of water used for irrigation and creates a regulatory framework for new water conservation schemes such as desalination and the use of grey water on parks and golf courses. The Yearbook says that there is an inverse relationship between water scarcity and price. Many municipally held entities in the water short regions of southern Spain continue to provide water at a loss, with tariffs covering 40% of operating costs.
The EU allocated EUR6 billion in funding for 2007-13 to support Poland's EUR12 billion investment plan for water and wastewater. This includes 30,000 of sewerage systems at EUR5 billion, upgrading 569 WWTWs and building 180 new WWTWs for EUR3.1 billion. In addition, annual spending on the water network is in excess of EUR1 billion per annum.
The compliance costs for water and wastewater upgrading and extending for EU accession has been variously estimated at between EUR18 billion and EUR40 billion in 1998, with USD2.6 billion required for sewage treatment works and USD4 billion for sewerage. Poland was granted derogation until 2015 for complying with the UWWTD because of the estimated cost of compliance.
In terms of PSP prospects the pace of PSP remains a leisurely one. In Warsaw urban water and sewerage services such as the second Warsaw STW have been reconstructed as limited companies, but remain directly under the control of the municipalities and the government's Environmental Council. Effectively all aspects of the operation of water and sewerage services are in the hands of the local authorities. It is up to each authority to decide if PSP will take place. The major French water companies have been helping to frame the PSP process. While the government remains committed to privatising water and sewerage services, there is some reluctance at municipal level. SAUR's experience in Gdansk may alleviate this.
Central Warsaw has 1.64 million inhabitants, 98% receiving potable water and 95% connected to the sewerage network. One sewage treatment work treats the effluents of 500,000 - 600,000 people.
The rest of the effluent is directly discharged into the Vistula River. The EBRD is encouraging Warsaw to float Miejskie Przedsiebiorstwo Wodociagow I Kananlizacji (MPWiK) in the shorter term, ideally through an IPO. The city's first STW has a treatment capacity of 240,000 m3 per day.
Information for the country profiles was taken from the Pinsent Masons Water Yearbook 2011-2012. For more information and to obtain a copy of the yearbook, please visit: http://wateryearbook.pinsentmasons.com/
More Water & WasteWater International Current Issue Articles
More Water & WasteWater International Archives Issue Articles
