Leakage Reductions: The Fundamental Role of Pressure Management
In the second part of a WWi series designed to provide practical advice to utilities, we tackle the growing concern of system leakage. Allan Lambert, leader of the 1st IWA Water Loss Task Force, provides a personal perspective on the ever-growing international recognition of how pressure management can influence leakage and asset management.
Pressure management in potable water distribution systems has increasingly become a high-profile topic over the last few years. More and more countries, in particular at a utility level, have realised the practical and economic benefits this process can bring. What has caused this surge of interest?
Tests on Japanese and UK distribution systems around 1980 showed an average relationship between pressure and leak flow rate in distribution systems that was stronger than the square root relationship between pressure and discharge through a fixed area orifice. Yet 20 years later, in an IWA International Report in 2000 summarising Water Loss management practices in 20 countries, the following was found:
• In six countries, pressure management was not mentioned or practised
• Seven countries were researching or considering pressure management
• Six countries were notably enthusiastic about the benefits of pressure management ('the preventative method par excellence' - Spain).
In 2003, the Pressure Management Team of the IWA Water Loss Task Force WLTF (now the Water Loss Specialist Group, WLSG) began to collate and publish their own research and recommendations, and encourage utilities to present Case Studies at international Water Loss symposia. FAVAD (Fixed and Variable Area Discharges) was recommended as the best practice concept for predicting pressure:leak flow relationships.
A few international case studies showing reduction of bursts following pressure management were not widely known internationally. Nor was it traditional practice within utilities to relate burst frequency to pressure, even when collecting national burst statistics for different pipe materials. Accordingly, very few practitioners believed that pressure management could influence burst frequency, other than for the control of pressure transients. This perspective started to change in 2005 and 2006, when the IWA WLSG Pressure Management Team published 112 sets of data from 10 countries, showing mostly significant reductions in burst frequencies after pressure management, together with:
• A general explanatory concept ('the straw that breaks the camel's back'), and
• Quick practical methods to identifying zones with good potential for burst reduction on mains, or services, or both, or neither.
The prospect of reducing burst repair and associated costs, and potential for improved asset management, created increased international interest in pressure management. Many hundreds of pressure management schemes have been implemented internationally since 2007, and whenever case studies are presented at conferences or published, the following benefits of pressure management are now usually quoted without challenge:
• Reduction of leak flow rates
• Possible reduction of burst frequency on mains
• Possible reduction of burst frequency on services
• Extension of residual asset life.
Other benefits include reduced costs of active leakage control, reductions of some components of consumption and improved service to customers from fewer interruptions to supply. Pressure management is now being used not only for leakage control, but also for demand management, water conservation and asset management. Table 1 below, from a recent Australian Research Project, summarises the various benefits. Utilities wishing to justify pressure management need to be able make predictions of these benefits, which vary from one situation to another. Reliable concepts and practical methods are needed to make a sound financial case for such investment, and for prioritising individual pressure management schemes.
This article briefly summarises the 'state of the art' of these concepts relating to leak flow rates and burst frequency, including developments since 2007, and also considers some other implications of pressure:leakage relationships.
Pressure:Leak Flow rate relationships
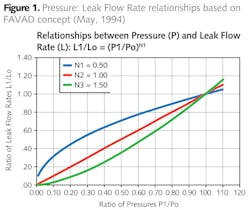
Japanese and UK research data in 1980 on pressure/leak flow rate relationships were reconciled with other test data worldwide using the Fixed and Variable Area Discharges (FAVAD) concept, proposed by independent English engineer John May in 1994. The most basic FAVAD equation is shown in Figure 1. If Po and Lo are the initial average zone pressure and leak flow rate, then at a different average pressure P1, the leak flow rate L1 can be predicted if the exponent N1 is known, or can be estimated.
For leakage paths where areas of leaks are fixed, the velocity of flow of a leak varies with the square root of pressure, so leak flow rate varies with P0.5 (upper curved line, N1 = 0.5). This relationship is often quoted (e.g. a 50% reduction in pressure gives a 30% reduction in leakage) but almost always underestimates the influence of pressure on distribution system leakage. This is because, for small undetectable 'background' leaks at joints and fittings, and for splits on flexible pipe materials, the area of the leak varies with pressure, so leak flow rate typically varies with P1.5 (lower curved line, N1 = 1.5), and a 50% reduction in pressure gives a 65% reduction in leak flow rate.
Targeting Zones for Burst Reduction – Quick MethodSystematically identify zones with high repair numbers and frequencies on mains and service connections, as that is where the greatest reductions are likely to be achieved. • Ensure that mains repairs and service connection repairs are analysed separately • Assume that a 'low level' of failure rate is consistent with frequencies used in calculations of Unavoidable Annual Real Losses (how low can you go?) namely: o Mains repairs: 13 per 100 km of mains/year o Services, main to property line: three per 1000 service connections/year (exclude small leaks at meters and stop taps from this calculation) o Underground services after the property line: 13 per 100 km per year. • Check if pressure transients are present; if so, take action to reduce them • Check for continuous excessive pressures at properties likely to experience lowest Zone pressures, and identify the possible % reduction to the average Zone pressure • For Zones where current repair frequencies are several times higher than the UARL reference frequencies shown above, assume the % reduction in burst frequency will (on average) be around 1.4 times the % reduction in maximum pressure. |
Distribution systems contain both fixed and variable area leaks in varying combinations, and the average relationship for large systems with mixed pipe materials is approximately linear – the leak flow rate reduces by 1% for every 1% reduction in average pressure. More detailed predictions of N1 can be made if required, or N1 values can be calculated from night tests on Zones, when pressure is reduced in stages and changes in night flow analysed.
Real losses – how low can you go?
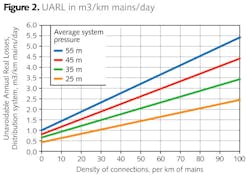
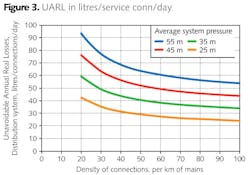
In 1999, the 1st IWA Water Loss Task Force developed an equation for Unavoidable Annual Real Losses (UARL), based on auditable assumptions of real loss components (background leakage, reported bursts, unreported bursts) for well maintained infrastructure in good condition. The UARL equation includes a linear relationship between UARL and average system pressure, and also allows for mains length, number of service connections, and location of customer meters relative to the property line.
Figures 2 and 3 show the substantial influence of average pressure and service connection density on the UARL, in m3/km of mains/day, and litres/service connection/day, for systems with customer meters sited at the property line. Yet average system pressures, connection densities and meter location are rarely quoted when comparisons of performance are made with traditional performance indicators.
The UARL is used in the calculation of the Infrastructure Leakage Index (ILI), which is the IWA metric performance indicator specifically developed for comparing technical performance in real losses management between countries and utilities with different key infrastructure characteristics.
Pressure: burst frequency relationships
Guidance in 2007 for targeting zones for burst reduction by pressure management involved:
• Checking for pressure transients and continuous excess pressures
• Estimating possible % reduction in AZPmax (maximum pressure at Average Zone Point)
• Calculating current repair burst frequencies, for mains and services separately.
Low levels of failure were assumed to correspond to burst frequencies used in the calculation of UARL, for well maintained infrastructure in good condition:
o Mains repairs: 13 per 100 km /year (excluding valve and hydrant repairs)
o Services, main to property line: 3 per 1000 service connections/year (excluding small leaks at meters and stop taps).
Where current burst frequencies were 'high' in relation to the above 'low' values, % reduction in burst frequency was predicted to be 1.4 x % reduction in AZPmax; this was based on the average of the 112 data sets published by the IWA WLTF PMT in 2006.
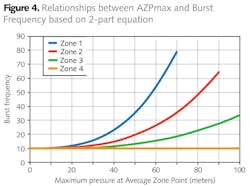
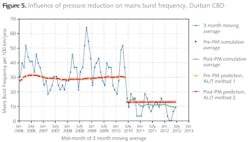
This simple targeting and prediction method for zones with 'high' burst frequency has generally been successful, but further research was needed. Good quality information collected and analysed since 2007 suggests a general relationship (Figure 4) between AZPmax and burst frequency BF of the form:
Burst Frequency BF = BFnpd + A x AZPmax3 (where BFnpd is the non-pressure dependent component of burst frequency, and A is a Zone parameter obtained by analysis of current burst frequency on mains, or services). Quick methods of assessing BFnpd have been developed and are currently being tested.
Each Zone will have a current starting point (Po, BFo) on its own curve. Do not mix mains and services burst data, as each Zone will have one relationship for mains, and a different relationship for service connections. The two-part equation also helps to explain why seasonal variations in burst frequency appear to be generally reduced by pressure management, as shown in figure 5.
Leak detection and repair wit out pressure management
Many Utilities will have experienced the situation where accumulations of bursts are repaired, but the leakage quickly returns to pre-repair levels; such problems seem particularly acute in zones with high leakage and low pressure. Using information in this article, it's not difficult to see why this occurs in zones without pressure management.
When the bursts are repaired, if the average pressure increases by, say, 10%, Figure 1 shows that the undetectable background leakage with a FAVAD N1 of 1.5 increases by 15%. The burst frequency (Figure 4) increases by up to 30%, and new bursts occur, so much of the benefit gained is quickly lost.
However, if the Zone has effective flow modulated pressure control, as the bursts are repaired the inlet pressure automatically reduces the Zone inlet pressure, to accommodate the effect of the reduced leakage. So installation of pressure management, when setting up new district metered areas in high leakage areas with low pressure, is good practice, and not as illogical as it may appear to be!
Reductions in repair costs and unplanned renewals
Reductions in the numbers of bursts – actual or predicted – can be easily converted to savings in annual repair costs. However, in many utilities, if there are more than a specified number of interruptions to supply in a year, in a given length of mains, sections of main are renewed as an 'unplanned' priority to meet customer service charters and key performance indicators. If pressure management results in a reduction of mains bursts, the number of these unplanned renewals schemes falls; capital allocated for them is saved and becomes available for spending on planned renewals or additional pressure management. In a recent Australian Case Study in which this saving was evaluated for one year, savings in repair costs of 215 fewer burst repairs was $0.37 million, but saving in deferred renewals of 11 km of mains was seven times greater, at $2.75 million
Final words
Understanding of the often subtle ways in which pressure influences leakage and asset life, and practical methods to predict the multiple benefits, have developed rapidly in recent years. The efforts of the IWA Water Loss Task Force and Specialist Group have encouraged more utilities to implement pressure management.
A linear relationship between leak flow rate and pressure is a reasonable starting assumption in most distribution systems. Moderate reduction of excess pressure produce demonstrable reductions of burst frequency in most systems. The resulting financial benefits include reduced repair costs, more efficient active leakage control and some increased residual infrastructure life.
Pressure management therefore has a fundamental role in many aspects of leakage and asset management. It is the catalyst which can speed the pace of change in improving the performance of utility distribution systems.
Author's note: Allan Lambert chaired the IWA Water Losses Task Force between 1995 and 1999 and is managing director of Water Loss Research & Analysis Ltd. Further papers on this topic are available from www.leakssuite.com.


