Tips on Conducting an Infiltration/Inflow Study
By Pat Stevens
Knowing the performance of a collection system is difficult because there are few standard benchmarks on what "performance" is and how it should be determined. Sewer performance, like beauty, is often "in the eye of the beholder" and can vary from the number of complaints received; to the number of overflows occurring; to knowing pump station flow at any given time; to a model-based prediction of future flow. Historically, many collection system managers paid little attention to quantifying sewer performance except with a simple "does it or doesn't it overflow?"
Essentially, there are two distinct variables that define collection system performance:
1. Wet weather flow produced by the service area or sewer shed during rain events
2. The carrying capacity of the downstream sewer pipes
null
The most stressful time for every collection system is during wet weather when Infiltration and Inflow (I/I) contribute excess flows to the system. As a result, I/I studies have become a common way for managers to measure performance. Properly conducted, an I/I study measures both variables of system performance: wet weather flow and carrying capacity. This article will discuss how to organize an I/I study to determine both the flows produced by the system and the carrying capacity of the pipes.
There are only a few operational choices available to allow the engineer conducting the I/I study to understand the effect of these two variables. Those choices include:
A. Size of mini-basins into which the sewer system is studied
B. Accuracy of flow measurement
C. Methods for calculating operational capacity
D. Accuracy and geographic resolution of rainfall measurement
E. Climatic season during which the study is conducted
F. Length of time during which wet weather flow response is measured
This paper will focus on the first three choices as they are often the most crucial to the success of an I/I removal project.
Mini-basin Sizing
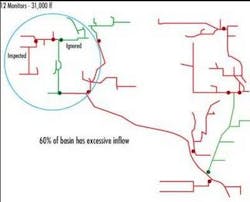
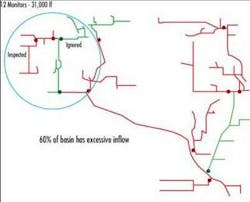
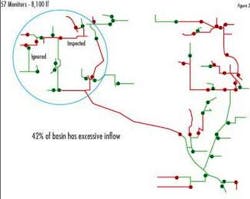
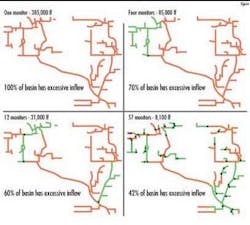
An essential element for an I/I study is flow monitoring and the size of basins created by meter placement. In 1990, ADS Environmental Services conducted an I/I study for the City of Indianapolis that revealed the importance of basin size for determining I/I distribution and severity. Figure 1 illustrates what ADS's flow monitoring strategy uncovered. The figure shows, in four scenarios, the portion of this 385,000 linear foot (LF) system that appears to have excessive I/I (red lines). The green lines represent the lines and neighborhoods that don't experience excessive I/I and do not require physical inspection or televising. The four scenarios differ only by the number of flow meters installed and resulting basin size.
The small 8,100 LF basin strategy identified just 42% of the system as suffering from excessive I/I. The manager is now able to spend time, effort and money on much smaller portions of the system.
This phenomenon repeats itself in every I/I study whereby smaller flow monitoring basins result in a larger percentage of the system requiring no follow-up work. In addition, the most valuable benefit is assuring the manager that sewer rehabilitation is focused on the portions of the system where I/I originates.
Figure 2 compares the location of failing mini-basins in red with the good basins in green. Red basins will undergo additional SSES and rehabilitation work. Notice in particular the change in location of the red and green segments within the circle. The engineer would come to strikingly different conclusions about the location of the inflow sources in this system, with the difference based entirely on the size of the basins. Notice that the engineer running the 31,000 LF project would have walked away from some basins (green) that become red when measured in 8,100 LF mini-basins. He/she would have been "looking for flow in all wrong places".
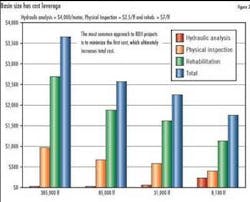
Economically, the SSES project receives benefit by employing smaller basins by reducing the length of pipe that SSES field crews must inspect and evaluate. Focusing on smaller portions of the system also reduces rehabilitation cost. At the same time, flow-monitoring costs increase as basin sizes are reduced but the increased costs from small basin flow monitoring is more than offset when compared with the savings realized from reduced rehab costs.
Figure 3 shows the relationship between rehabilitation costs, SSES field costs and flow monitoring costs as basin size reduces. Clearly, this phenomenon can allow an engineer or owner to decrease the cost of performing the Sewer System Evaluation Survey (SSES) fieldwork by decreasing basin sizes and isolating I/I sources into smaller sections of the collection system. But what is the optimum size? As it turns out there are logical limits.
A collection system can be thought of as a tree with a trunk, branches and leaves. The leaves are neighborhood or housing sub-division sewers and are the smallest unit of a sewer system that likely experience uniform I/I. Housing sub-divisions were constructed at the same time, by the same contractor, with the same pipe materials and with the same methods. Housing sub-division "leaves" are usually in the 5,000 to 10,000 LF size and are the practical basin size for I/I studies.
The upper "leaf" basins usually are formed by a single meter measuring all the flow from the sub-division. Meters placed further downstream on branches and trunks logically form larger basins in the 10,000 to 20,000 LF range. I/I from these basins is usually derived by subtracting an upstream flow from the downstream meter.
Accuracy of Flow Measurement
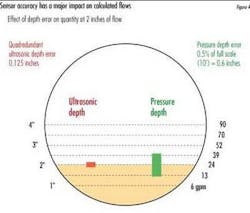
Historically, perhaps one reason basin size has not been a more prominent strategy relates to the inaccuracies of pressure depth instruments. In the decade after the passage of the Clean Water Act, pressure depth sensors were the only generally available depth measurement devices. In fact, even today some managers still use pressure depth. Inherent with this technology is pressure sensor drift. Drifting pressure sensors lead to wild swings in upstream and downstream flow rate totals.
Figure 4 illustrates the dramatic impact "drift" can have on calculating flows. This 8
Lack of precision in flow measurement in 8" pipes in the upper leaf mini-basins can be very painful. When downstream meters measure less flow than upstream meters, which we know cannot logically be true, engineers experience "the pain of subtraction". As a consequence, this pain has been avoided by installing meters so far apart - 40,000-50,000 LF - that the difference in flow rates are larger than possible meter errors. Although self-defeating for effectively isolating I/I distribution and severity, pain of subtraction issues pushed engineers toward measuring larger basins.
Calculating Operational Capacity
Flow meters installed for I/I measurement can also determine a pipe's capacity. Flow meters used for I/I analysis measure both depth and velocity and calculate a flow rate. A scattergraph plot of the depth and velocity reading reveals the hydraulic conditions in the sewer. All open channel flow operating in gravity flow follows a prescribed depth and velocity relationship. Robert Manning described the relationship in the Manning Equation in the late 1800's. Depth and velocity data from a flow meter should follow the Manning relationship.
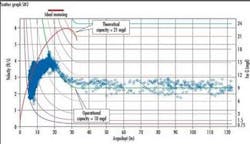
However, a sewer pipe has both a Theoretical Capacity and an Operational Capacity, an important distinction for understanding capacity and rehabilitation options. Both capacities can be approximated by reviewing a scattergraph of flow meter data collected from a sewer that operated through its full range of depth, including surcharge depth. ADS prepared the scattergraph in Figure 5 for a customer to analyze its operational capacity. The resulting scattergraph of 30 days of depth and velocity data from a 33-inch sewer illustrates the importance of not relying on theoretical capacity when analyzing I/I's impact on performance.
In this scattergraph, depth is on the bottom axis and velocity is on the left axis. The red ideal Manning curve shows the expected depth-velocity relationship for gravity flow. The scattergraph includes Iso-Q(tm) lines (lines of constant flow rate). The scale on the right is the flow rate in MGD for the Iso-Q lines.
The scattergraph reveals that this sewer operated in surcharge (125 inches deep) for a time. The upper end of the Manning curve ends on the Iso-Q line of 21 mgd, which is the pipe's Theoretical Capacity. The blue data points at full pipe (33 inches) fall on the 10 MGD Iso-Q line, which is the pipe's Operational Capacity. A collection system manager would see that the pipe is operating at half of its theoretical capacity (10 mgd/21 mgd). In addition to removing I/I in upstream sewer, the manager should also investigate the cause of the pipe restriction.
Conclusion
Successful I/I studies that precisely identify I/I distribution and severity depend upon choosing the correct strategies and techniques before the project begins. These strategies may require managers and engineers to change their fundamental approach to wet weather analysis. The evidence for change is compelling. For every project that employs smaller basins and higher accuracy measurements, the same benefits are realized. First, I/I severity and distribution is isolated and second, because it is, resources are more wisely applied. Scattergraphs provide an additional tool for visualizing carrying capacity, often revealing bottlenecks that can be removed very cost effectively.
About the Author: Pat Stevens is Vice President of Engineering for ADS Corp, a provider of wastewater flow information and related services. Stevens has directed I/I flow monitoring projects at ADS for 13 years. During that time, ADS has provided flow monitoring for 16 of the 19 most successful I/I removal projects worldwide. (Source: I/I basin removal technical papers presented at engineering and technical conferences over the last 15 years.)
