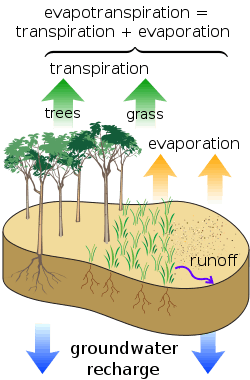
Photo courtesy of Mwtoews
|
"Since evapotranspiration consumes more than half of the precipitation that happens every year, knowing the evapotranspiration rates in different regions of the country is a solid leap forward in enabling water managers and policy makers to know how much water is available for use in their specific region," said Bill Werkheiser, associate director for water at the USGS. "Just as importantly," he added, "this knowledge will help them better plan for the water availability challenges that will occur as our climate changes since transpiration rates vary widely depending on factors such as temperature, humidity, precipitation, soil type, and wind." In spite of its importance, evapotranspiration has been difficult to measure accurately on a regional or continental scale. To produce these maps, USGS scientists Ward Sanford and David Selnick examined Landsat satellite imagery for climate and land-cover data from 1971 to 2000 and streamflow data for more than 800
watersheds for the same time period. This information allowed them to generate a mathematical equation that can be used to more precisely estimate long-term evapotranspiration at any location in the continental United States. "The map of the long-term average annual evapotranspiration rates for different areas should be immensely helpful for ensuring the long-term, sustainable use of water in different regions, especially since forecasted climate change will, in many places, change the amount of precipitation and evapotranspiration that occurs," Sanford said. "This tool, for example, allows water managers to quantify
surface water runoff to reservoirs or water recharge to aquifers. It will also enable natural resource planners to understand the water needed for healthy-functioning ecosystems." One interesting finding illustrated in the maps is that in certain regions of the United States, such as the High Plains and the Central Valley of California, evapotranspiration exceeds the amount of precipitation because water is imported from other regions. The map also shows that the Pacific Northwest has many areas with low evapotranspiration to precipitation rates because of the area’s very high rainfall and low-to-moderate temperatures. In contrast, counties in the arid Southwest have evapotranspiration rates that usually exceed 80 percent of precipitation.
###


