EPA Drinking Water Survey Finds $150 Billion in Needs
U.S. drinking water systems need to spend an estimated $150.9 billion over the next 20 years to maintain drinking water infrastructure, according to a survey conducted by the U.S. Environmental Protection Agency.
EPA's 1999 Drinking Water Infrastructure Needs Survey covered the nation's approximately 55,000 community water systems and 21,400 not-for-profit noncommunity water systems. The survey was compiled in a report to Congress and published in late February.
The Association of Metropolitan Water Agencies (AMWA) took issue with the report, saying it only reflected a portion of the actual need.
"The EPA data is informative, but it only represents about one-third of the total infrastructure costs facing the nation's 55,000 water suppliers," said Diane VanDe Hei, the executive director of AMWA, an organization of the nation's largest publicly owned drinking water systems.
The reported total covers specific documented infrastructure needs, mainly those related to compliance with current and future EPA rules. It does not include the vast majority of needs not documented by states, including the cost of replacing aging treatment facilities and distribution systems, which represents the largest infrastructure expense facing the nation's water suppliers, an AMWA spokesman said.
EPA's figure is modest compared to the estimate developed by the Water Infrastructure Network, which says that drinking water systems will need approximately $23 billion per year for the next 20 years - or $460 billion - to upgrade and replace aging drinking water treatment facilities and distribution systems and also comply with EPA rules. WIN found similar needs for wastewater systems. WIN based its findings not only on EPA data, but also on data from the Department of Commerce, the Census Bureau and the American Water Works Association.
Of the total 20-year need outlined in the EPA Drinking Water survey, $102.5 billion is needed now to ensure the continued provision of safe drinking water. Large and medium-sized systems account for most of the total need, although small systems have the greatest needs on a per-household basis.
The results of the survey support the findings of the first Drinking Water Needs Survey, conducted in 1995, by documenting the continued need to install, upgrade, and replace the infrastructure on which the public relies for safe drinking water. The 1995 survey estimated a total national need of $138.4 billion. Adjusted to 1999 dollars that would represent $152.6 billion today.
The Drinking Water Infrastructure Needs Survey is designed to estimate the documented 20-year capital investment needs of public water systems eligible to receive Drinking Water State Revolving Fund (DWSRF) monies. The survey includes infrastructure needs that are required to protect public health, such as projects to preserve the physical integrity of the water system, convey treated water to homes, or ensure continued compliance with specific SDWA regulations.
As required by the SDWA, EPA will use information from the survey to allocate DWSRF funds to the states. Each state develops a priority system for funding projects based on public health criteria specified in the SDWA. Annual appropriations to the DWSRF are allocated to each state based on its share of the total national need - with each state receiving a minimum allotment of 1 percent of available funds.
Total National Need
Although the total estimate of need is large, EPA emphasized that the methods used by the survey produce a conservative estimate of need. EPA said most of the needs represent projects that systems would address as preemptive measures to ensure the continued provision of safe drinking water, rather than as remedial actions to correct an existing violation of a drinking water standard. In addition, the majority of the total need derives from the inherent costs of being a water system which involves the nearly continual need to install, upgrade, and replace the basic infrastructure that is required to deliver safe drinking water to consumers.
The nation's 886 largest community water systems (each serving more than 50,000 people) account for the greatest share, 41 percent, of the total national need. Medium and small community water systems also have substantial needs of $43.3 billion and $31.2 billion, respectively. The Virgin Islands and the Pacific Island territories represent $387.5 million of the total need.
The survey estimates that not-for-profit noncommunity water systems have $3.1 billion in needs. American Indian water systems need $1.2 billion in infrastructure improvements, while Alaska Native Village systems require $1.1 billion.
About 68 percent of the total need, $102.5 billion, is needed now to continue to protect the public health and maintain existing distribution and treatment systems.
Current needs are projects that a system would begin immediately. In most cases a current need would involve installing, upgrading, or replacing infrastructure to enable a water system to continue to deliver safe drinking water. For example, a surface water treatment plant may currently produce safe drinking water, but the plant's filters may require replacement due to their age and declining effectiveness, if the plant is to continue to provide safe water.
Future needs are projects that water systems expect to address in the next 20 years as part of routine rehabilitation of infrastructure or due to predictable events such as reaching the end of a facility's service-life. Approximately 32 percent of the total need, $48.4 billion, is reported as future needs.
Total Need by Category
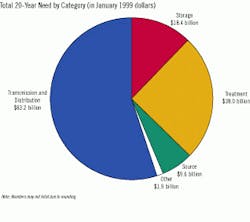
Every project in the survey belongs to one of five categories of need: source, transmission and distribution, treatment, storage, and "other." Each category represents projects that are of critical importance to providing safe drinking water.
- With $83.2 billion needed over the next 20 years, transmission and distribution projects constitute the largest category of need. Although the treatment plant is usually the most visible component of a water system, most of a system's infrastructure is buried underground in the form of transmission and distribution mains.
The transmission and distribution category includes the installation and rehabilitation of raw and finished water transmission pipes, distribution water mains, replacement of lead service lines, flushing hydrants, valves, and backflow prevention devices.
- Treatment projects represent the second largest category of need, $38 billion over the next 20 years.
This category consists of projects needed to reduce contaminants through, for example, filtration, chlorination, corrosion control, and aeration. More than half of the total treatment need, $22.7 billion, is needed to address contaminants that pose acute health risks. The installation, upgrade, or rehabilitation of treatment infrastructure also is required to remove contaminants that can cause chronic health effects or taste, odor, and other aesthetic problems.
- The total 20-year need for storage projects is $18.4 billion. This category includes projects to construct new or rehabilitate existing finished water storage tanks. A water system with inadequate storage capacity cannot always provide water at pressures sufficient to prevent back-siphonage of microbial contaminants.
In addition, constructing new tanks is necessary if the system cannot meet peak demands. Many projects in this category involve rehabilitating existing tanks to prevent structural failures that can cause microbiological contamination.
- The source category includes projects that are necessary to obtain safe supplies of surface or ground water. The infrastructure needs in this category include the installation and rehabilitation of drilled wells. The total 20-year need for source water projects is $9.6 billion.
- Other needs account for an estimated $1.9 billion. This category captures needs that cannot be assigned to one of the prior categories. Examples include emergency power generators, computer and automation equipment, and improvements for flood or earthquake protection.
The Regulatory Need
The SDWA aims to ensure that public water systems meet national standards to protect consumers from the harmful effects of contaminated drinking water. Although all of the infrastructure projects included in the survey promote the SDWA's public health objectives, some are directly attributable to SDWA regulations.
The report refers to these needs collectively as the "regulatory need." The total regulatory need is divided into two broad categories: existing SDWA regulations and recently promulgated and proposed regulations.
The total regulatory need accounts for 21 percent, or $31.2 billion, of the total national need. This statistic reveals that most of the total need results from the costs of installing, upgrading, and replacing the basic infrastructure that is required to deliver drinking water to consumers -- costs that are borne by water systems independent of the SDWA.
Existing SDWA Regulations
The estimated need directly associated with existing SDWA regulations is $21.9 billion.
Projects to address microbiological contamination account for 91 percent, or $19.8 billion, of the regulatory need. Under the SDWA, the Surface Water Treatment Rule (SWTR) and the Total Coliform Rule (TCR) are designed to reduce the amount of microbial contaminants in drinking water. The installation of a treatment plant to filter a surface water source and the installation of a disinfection system are examples of needs associated with this category.
Infrastructure needs to protect the public health from chemical contaminants comprise $2.1 billion of the regulatory need. This category includes projects necessary for compliance with the Nitrate/Nitrite Standard, Lead and Copper Rule, Total Trihalomethanes Standard, and other regulations that set maximum allowable limits for organic and inorganic contaminants. Examples of projects in this category are aerating water to remove volatile organic compounds and applying corrosion inhibitors to reduce the leaching of lead from pipes.
The total need for proposed and recently promulgated regulations is $9.3 billion. Of this total, $2.6 billion is for the regulation of acute contaminants under the Interim Enhanced Surface Water Treatment Rule (IESWTR), Long Term I Enhanced Surface Water Treatment Rule (LT1), Ground Water Rule, and Filter Backwash Recycling Rule.
The remaining $6.7 billion is for chronic contaminants regulated under the Stage 1 Disinfectants/Disinfection Byproducts Rule (DBPR), Arsenic Rule, Radon Rule, and Radionuclides Rule.
Economic Challenges Faced by Small Water Systems
Approximately 45,000 of the nation's 55,000 community water systems serve fewer than 3,300 people. Small water systems face many unique challenges in providing safe drinking water to consumers. The substantial capital investments required to rehabilitate, upgrade, or install infrastructure represent one such challenge.
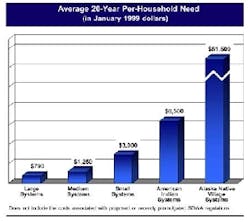
Although the total small system need is modest compared to the needs of larger systems, the costs borne on a per-household basis by small systems are significantly higher than those of larger systems.
The total need for American Indian and Alaska Native Village systems is $2.2 billion over 20 years. The significance of this need in terms of public health is underscored by considering the per-household costs, which average $6,500 for American Indians and $51,500 for Alaska Natives. The difficulty in transporting materials to remote areas, the lack of economies of scale for small system projects, and the limited annual construction period in some regions contribute to the high per-household costs for these systems.


