Know Your Flow: Flow Monitoring Provides Reliable, Cost-Effective Solution for Mitigating Inflow/Infiltration
As long as there have been collection systems, there has been the issue of inflow and infiltration (I/I). Municipalities and municipal utility authorities have the responsibility of measuring, quantifying, analyzing, assessing, and removing the I/I from the system.
A staple in this removal process is flow monitoring. Some of the most common reasons to conduct flow monitoring include:
- Sewer System Evaluation Surveys (SSES)
- Capacity Management Operations and Maintenance (CMOM) Programs
- I/I analysis -- peaking factor determination
- I/I analysis -- basin comparison/prioritization
- Pre- and post-rehabilitation comparisons
- Billing of satellite communities
- Hydraulic model calibration
If a meter is being used for billing, it is obvious that a permanent meter is necessary. When only a simple basin-by-basin comparison is necessary to determine the area with the most significant I/I, a short-term flow monitoring program of 10 weeks to 3 months may be appropriate and sufficient.
However, when flow monitoring is being used to establish trend data, calibrate hydraulic models and utilize the results for capital improvement program planning, long-term flow monitoring is recommended. For the purposes of this discussion, long-term flow monitoring is considered to be durations of one year or longer. Some of the advantages for considering long-term flow monitoring are sample size, rain event sizes, seasonal variation and groundwater infiltration, the capturing of large storm events, and cost savings.
The first three advantages are each related. One of the most-used tools when analyzing flow metering data is the Q vs. I (excess flow versus rainfall intensity) regression analysis. The regression analysis is a graphical representation of flow through a meter during various sizes of rain events of a selected duration. Each example discussed will show how the regression analysis curve can be impacted by long-term flow monitoring.
Sample Size
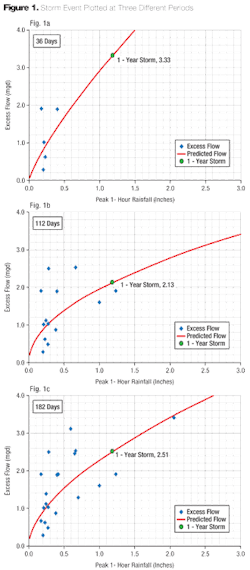
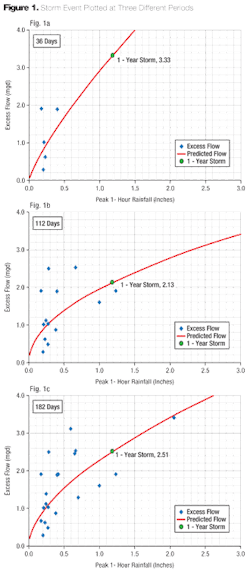
The theory behind flow monitoring is very similar to that of predictive polling. Both are statistical tools used to capture a representative sample of data and use that data to predict an outcome for the whole. The larger the sample size, the more representative the result will be. Flow monitoring captures multiple rainfall events and dry-weather periods that are used to represent how a collection system will react under variously-sized storm events. The more storm events captured, the more accurate the predictions will be. In Figure 1, the 1-year, 1-hour storm event is plotted at three different periods during the flow monitoring.
When only five events have occurred, the predicted 1-year storm event correlates to 3.33 million gallons per day (MGD). After 100 days and over a dozen rain events, the 1-year storm is predicted to be 2.13 MGD. Then, after six months of data collection, the flow in a 1-year event settled in at 2.51 MGD. The first result was therefore 33 percent high, and the second was 15 percent low, resulting in a flow variation of 48 percent. The longer the meters are left in, the greater the sample size of data being used. In this situation, the seasonal variation described later is evident in the third graph, as there was significant variation in excess flow for multiple storm intensities.
In the ideal situation, the sample size becomes sufficiently large so that each subsequent rain event has negligible effect on the predicted excess flow.
Rain Event Sizes
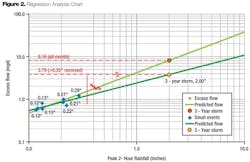
Long-term flow monitoring increases the chances of capturing rainfall events of varying sizes. As indicated by the regression analysis (see Fig. 2), if the rainfall events of greater than 0.35 inches are eliminated, the estimated 3-year storm event flow rate drops from 8.16 to 3.79 MGD -- a 54 percent decrease. If the results of a flow monitoring program were used to calibrate a model and size a wet-weather storage facility, would using less data be acceptable? To use the polling analogy again, if multiple demographics are not polled, the results are bound to be skewed.
Seasonal Variation & Groundwater Infiltration
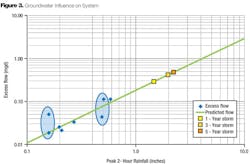
One of the major contributors of excess flow in a sewer collection system is infiltration. In the spring months and the wetter seasons of the year, the groundwater table is elevated. When it rains, the table is raised, often above the level of the sewer system, if only for a short period of time during and after the rain. This effect can be marked on the amount of flow entering the system. Figure 3 shows an example of a system influenced by groundwater.
In the two events circled, the system had a drastically different response due in part to the groundwater levels and degree of infiltration to which the tributary pipes are exposed. Using long-term flow monitoring through wet and dry periods allows for multiple storms of similar intensity to be compared. Not only does this help increase the accuracy of a regression analysis, but engineers and data analysts can infer information about the characteristics of the groundwater influence and its effects on a system.
While short-term flow monitoring may be sufficient to prioritize basins, if a major flow reduction program is being implemented, it is extremely important that a solid baseline is set -- not only for numerous samples of wet weather but also for an understanding of the baseline dry weather flows throughout the seasons. For larger systems, particularly those with satellite systems where flow reduction will be expected, this established baseline flow rate is critical.
Capturing Large Storm Events
The next reason for long-term flow monitoring has more to do with statistics than science. When completing a short-term flow monitoring project, one might encounter a 1-, 2- or 5-year event or larger, but it is just luck. With long-term flow monitoring, one will eventually experience one or more of these larger events and can see how the system reacts.
The system often reacts very differently in these larger events. These events are causing basement backups and overflows and are typically the reason the system is being studied. Completing a study that does not analyze the exact situation causing the problem means that one is merely looking at trends. Having a monitored event that triggers SSOs, basement backups or CSOs provides a greater degree of certainty when performing models or extrapolations of data in designing major improvement programs.
This additional information is particularly critical if one has recognized capacity limitations and needs to understand their impact better. Likewise, this large-storm data is most important when monitoring interceptors on larger systems.
Cost Savings
Last in the minds of most governmental entities is the cost savings that can be realized by completing long-term flow monitoring. The standard unit of measurement for billing flow monitoring programs is the cost per meter-day, meaning the cost of one meter installed for one day. However, a large portion of the costs of a properly-conducted flow monitoring program are incurred on the front end or are onetime costs regardless of the length of the program (e.g., site selection, meter installation, meter calibrations, and reporting). It is easy to see, then, how the daily cost allocation of these services decreases when the flow metering duration is increased.
When increasing the duration from 10 weeks to one year, cost savings of 40 to 60 percent on the price per meter-day can often be realized. If a municipality or district purchases the meters, the cost savings can be even greater when studying a site for multiple years.
While not the recommended option for all cases and studies, long-term flow monitoring can provide valuable information when accurate predictions for design storm events are desired. The accuracy and certainty provided by long-term flow monitoring are critical when calibrating a hydraulic model, evaluating the performance of rehabilitation programs, and evaluating excess flow in the design of capital improvement programs.
About the Author: Zach Matyja, P.E., is a client manager for RJN Group's Central Region based in Wheaton, Ill. He is a professional engineer licensed in Colorado, Illinois and Indiana and has over 12 years of experience in helping communities find solutions to their underground infrastructure problems.


