USGS releases detailed groundwater availability maps for Arizona

May 22, 2023
Combining over 1.8 million depth-to-groundwater measurements from 1891 through 2022, the Arizona Groundwater Explorer provides a depth of information on groundwater levels for the state.

The U.S. Geological Survey (USGS) announced that it has released a series of new interactive maps on groundwater availability throughout Arizona.

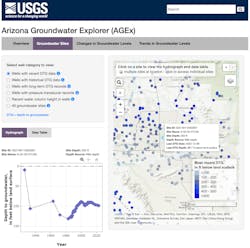
Called the Arizona Groundwater Explorer, or AGEx, the maps provide information on historical, current, and variance in groundwater levels in Arizona to help sustainably manage the shared resource. The information will support the efforts of water managers, decisionmakers, and the public.

“Groundwater is a critical water resource in Arizona, and mostly invisible,” said Fred Tillman, USGS research hydrologist and lead author of the study. “The AGEx maps allow people to visually explore groundwater levels in their areas of interest in the state, rather than deciphering information from databases.”

Depth-to-groundwater data for the maps were compiled from publicly available sources at the Arizona Department of Water Resources and USGS. The combined dataset contained 1,820,122 depth-to-groundwater measurements from 1891 through 2022 from 41,918 wells in Arizona. Data views were created from this dataset for 20 topics organized by three themes on the AGEx site:
  1. Groundwater Sites
    Groundwater-related questions such as “how deep is it to groundwater in my area”, “how deep was it to groundwater long ago”, and “how much water is in wells in my area”, among others, are addressed by data views in the Groundwater Sites theme.
  2. Changes in Groundwater Levels
    The Changes in Groundwater Levels theme presents data views for groundwater questions such as “where have groundwater levels fallen, and by how much” and “where have groundwater levels risen, and by how much” for both historical and recent time periods.
  3. Trends in Groundwater Levels
    Finally, maps in the Trends in Groundwater Levels theme addresses questions such as “how are groundwater levels trending in my area of interest” for ten overlapping decades. Well locations for each data view are displayed on interactive maps, with well information and hydrographs of data presented by hovering over or clicking on site locations on the maps.

Sponsored Recommendations

ArmorBlock 5000: Boost Automation Efficiency

April 25, 2024
Discover the transformative benefits of leveraging a scalable On-Machine I/O to improve flexibility, enhance reliability and streamline operations.

Rising Cyber Threats and the Impact on Risk and Resiliency Operations

April 25, 2024
The world of manufacturing is changing, and Generative AI is one of the many change agents. The 2024 State of Smart Manufacturing Report takes a deep dive into how Generative ...

State of Smart Manufacturing Report Series

April 25, 2024
The world of manufacturing is changing, and Generative AI is one of the many change agents. The 2024 State of Smart Manufacturing Report takes a deep dive into how Generative ...

SmartSights WIN-911 Alarm Notification Software Enables Faster Response

March 15, 2024
Alarm notification software enables faster response for customers, keeping production on track