The specific aim of this study is to measure the water-quality improvement as a result of a constructed stormwater wetlands retrofitted into an established urban community. This study was conducted in the constructed wetlands and lake system in the City of Pine Lake, GA. Sample points were designated at four strategic locations in the system and collected during the summer months of June through August 2013 and winter months of December 2013 through January 2014. Effluent from the constructed wetlands was lower than the influent. Total coliform mean decreased by 2073 MPN/100 mL (p<0.0001), while the E. coli mean decreased by 232 MPN/100 mL (p<0.0001), and conductivity mean decreased by 3.3 uS/cm (p<0.0001). MPN qualifies the value as the most probable number. The degree of decrease changed with each season. Absolute and relative differences were associated with temperature and rainfall.
Background and Significance
Constructed wetlands are a well-regarded option for treating various wastewater streams because of their ability to absorb nutrients and their proven efficacy to reduce industrial pollutants (Gosselink and Mitsch 1993, EPA 1993). The high pollution removal efficiencies are obtained by maximizing water retention, sediment settling, chemical adsorption, microbial breakdown, plant uptake, and groundwater recharging (Bekilou et al. 2005). Constructed stormwater wetlands are designed to address the volumes associated with rainfall variability and impervious surface runoff rates.
Since most pollutants are introduced into stormwater during the early part of each runoff event (first flush), it is essential to maximize the capture of the early runoff using various best management practice (BMP) components (Fulcher 1994, Bang and Lee 2000, Bang et al. 2001, Dwight et al. 2002, Li et al. 2007).
However, the variability in runoff volume and the uncertainty associated with some pretreatment systems suggest that site-specific BMP and pretreatment elements should be considered (Langeveld et al. 2012, Koob et al. 1999). Finally, physical and geophysical site limitations, human accessibility and safety requirements, and political and public considerations also weigh in on the selection of the most suitable BMP, whether it is a grass strip, bioretention, bioswale, detention basin, porous pavement, rain garden, retention pond, wetland basin, or other composite feature (International Stormwater 2012, Zarus et al. 2006, Zarus and Howland 2012). Therefore, a stormwater wetlands system that is to be sited within a well-established urban community must be designed for the community to accept and enjoy (Woolson 2005, Ledbetter 2012). The best solution is a compromise between water-quality improvements, flood prevention, aesthetics, and minimization of private property acquisition as well as costs of construction and maintenance (Zarus and Howland 2012).
Physical, chemical, and biological processes combine in wetlands to remove contaminants from wastewater. An understanding of these processes is fundamental not only to design wetland systems but also to understand the fate of chemicals once they enter the wetlands. Theoretically, wastewater treatment within a constructed wetland occurs as it passes through the wetlands medium and the plant rhizosphere. A thin film around each root hair is aerobic due to the leakage of oxygen from the rhizomes, roots, and rootlets. Aerobic and anaerobic microorganisms facilitate decomposition of organic matter. Microbial nitrification and subsequent denitrification releases nitrogen as gas to the atmosphere. Phosphorus is co-precipitated with iron, aluminum, and calcium compounds located in the root-bed medium (Brix 1994). Suspended solids filter out as they settle in the water column in surface flow wetlands or are physically filtered out by the medium within subsurface flow wetland cells. Harmful bacteria and viruses are reduced by filtration and adsorption by biofilms on the rock media in subsurface flow and vertical flow systems (Brix 1994). Because of the limited greenspace in the study site, efforts were made to increase the effective treatment area by incorporating isolated areas that allowed for treatment beyond the typical rhizosphere, by expanding the root zone, and by creating bioactivated filtration areas (Maryland 2000, Christianson et al. 2004, Wong and Breen 2002).
Introduction
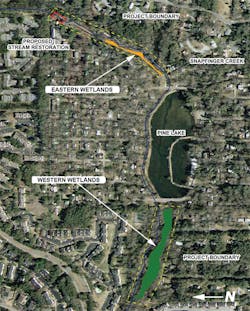
The city of Pine Lake, GA, is located approximately 10 miles east of downtown Atlanta. It was established in the late 1930s as a summer retreat centralized around a small lake of approximately 13 acres in area. As the Atlanta region grew to house millions of people, the water quality in Pine Lake degraded and the frequency of flooding increased. Infill reduced greenspace, and the city was able to acquire some land in the floodplain to develop wetlands to pretreat the city’s stormwater (Zarus et al. 2006, Zarus and Howland 2012, Manhard 2007, Styes 2014). Figure 1 shows an aerial view of the constructed wetland system (Manhard Consulting Ltd. 2007).
The following stormwater elements were created:
- The Eastern Wetlands
- An in-ground bioretention feature (south of lake, not visible in figure)
- An enhanced two-bay lake impoundment (Pine Lake)
- The Western Wetlands
The aim of this study is to measure the water-quality improvement as a result of the constructed wetlands (Eastern Wetlands) upstream of the lake. It is hypothesized that the constructed wetlands will improve water quality by lowering total coliform, E. coli, and turbidity concentrations and perhaps lower levels of conductivity as well.
Materials and Methods
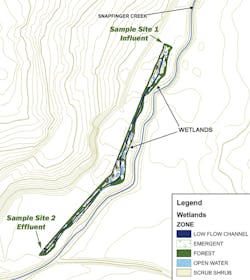
Study Site. The Eastern Wetlands are the first treatment feature in the Pine Lake wetland system. The Eastern Wetlands were built within a thin strip of land along a half-mile section of Snapfinger creek. Figure 2 is a map showing the relative dimensions of the wetlands (Manhard Consulting Ltd. 2007)
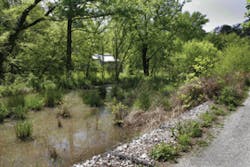
Water flows from Snapfinger Creek through a series of diversion gates (site 1- influent) into the Eastern Wetlands and exits via a small channel (site 2- effluent) leading to a pipe that feeds the lake. Figure 3 is a photograph of one of the small bays along the Eastern Wetlands along with a section of the recreational trail that extends the length of the wetland system. The area of the drainage basin entering the Eastern Wetlands is approximately 2.7 square miles (7.0 square kilometers).
Sample Collection. Sample points were designated at the influent upstream of the Eastern Wetlands and the effluent from the Eastern Wetlands, prior to discharge to the lake (Figure 2).
The following field measurements were obtained at each site during each sampling event: turbidity (accuracy ±2%), conductivity (±1%), water temperature (±0.15°C), air temperature, pH (±0.2 units), and dissolved oxygen (DO2) (±0.2 mg/L) using a Hydrolab Quanta multiparameter probe and LaMotte 2020 turbidimeter (O’Dell 1993). The meters were calibrated per operating manual instructions before each sampling event. When possible, samples were obtained in the morning as well as the late afternoon to determine if the diurnal cycle was related to variation in coliform results. Variation related to the diurnal cycle was expected for DO2 and pH. The initial intention was to collect samples only during times of at least 48 hours with no previous rain. However, the amount of rain was so excessive over the course of collection time that this was not possible. The period was one of the top 10 wettest seasons ever recorded for the state (NOAA 2013 a and b). Samples were collected during the summer months of June through August and winter months of December through January. During the summer months 13 sets of samples were obtained, and 17 sets during the winter months. Overall, 30 samples of each parameter were collected at sample sites 1 and 2.
Laboratory analysis of total coliform and E. coli samples was performed using IDEXX 2000 trays with Colilert snap packs. Samples were collected using a Corning 1700-100 120-mL sterile coliform water test sample container with sodium thiosulfate tablet. A blank sample (distilled water and Colilert reagent) was collected for each day. The samples were transported on ice to the nearby Emory University laboratory for processing well within an eight-hour holding time. Analysis consisted of method #9223B Enzyme Substrate Coliform test, 21st Edition (EPA 2005, Dichter 1990).
Rain data were obtained using US Geological Survey online records for Site Number 02203950, Snapfinger Creek near Decatur, GA, DeKalb County, GA, which includes the study site drainage basin, located approximately 2 miles south and downstream (USGS 2014).
Other Sampling Data. The DeKalb County Board of Health’s Environmental Health group regularly samples lake water at the Pine Lake public beach (downstream of the Eastern Wetlands effluent). Samples are analyzed by the county’s Water and Sewer Division, Public Works Department, using the membrane filtration method. Geometric mean is a type of average using the logarithmic value of the data converted back to a base-10 value. It is determined based upon four consecutive measurements as an indication of the quality of the water at the lake.
Statistical Analysis Methods. The null hypothesis is that the data are normally distributed. The p-value for the Kolmogorov-Smirnov test statistic was used to determine whether the null was rejected. A p-value >0.15 indicated failure to reject the null; i.e., normality was assumed. When normality was assumed, Student’s t-Test was used to determine the statistical significance of the particular dataset. When normality could not be assumed, Wilcoxon Signed-Rank Test was used.
Statistical analysis of paired data was performed using SAS 9.3. Associations were calculated by using paired t-Tests of difference between the samples and two-sided p-values. The means procedure was used to determine 95% confidence intervals. Total coliform and E. coli values were natural log transformed for normality.
Analysis of variance (ANOVA) was calculated by entering sample number, mean, and standard deviation in the ANOVA calculator at www.openepi.com (Sullivan et al. 2011). These calculations determined the effect, if any, of 48-hour rainfall on the various parameters.
Results
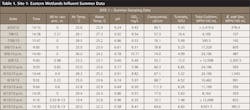
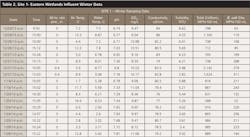
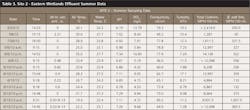
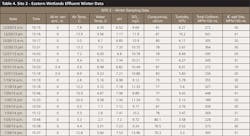
The sampling results varied widely during the sampling periods, with total coliform ranging from 189 to 24,196 MPN/100 mL and E. coli, ranging from 10 to 2,306 MPN/100 mL. The complete sampling results are provided in Tables 1 through 4. Influent (site 1) measurements made during the summer are provided in Table 1 and those during winter in Table 2. Effluent (site 2) measurements made during the summer are provided in Table 3 and those during winter in Table 4. The statistical comparisons between site 1 and site 2 are presented in Table 5. The complete data on all parameters are available online (Styes 2014).
Diurnal patterns of pH, DO2, and temperature are evident on days that were sampled in the morning and late afternoon (Tables 1 through 4). Coliform concentrations do not appear to be associated with diurnal changes; however, higher coliform levels are generally preceded by rain within 48 hours. Total coliform and E. coli concentrations at the influent and effluent are both lower during the winter months and less variable.
E. coli, total coliform, and turbidity measurements showed an increase that may be associated with rain, but no association was found between rain and pH, DO2, or conductivity. Wet conditions were defined as those that occurred within 48 hours of rain, and dry conditions those that exceeded 48 hours since rain. Total coliform and E. coli experienced a general increase during wet conditions with the exception of somewhat elevated concentrations on August 6, 2013, at both sites, where the most recent rainfall occurred on July 31, 2013. E. coli samples obtained during the summer months at the influent in wet conditions resulted in a mean of 825 MPN/100 mL versus 404 MPN/100 mL during dry periods. The ANOVA calculation for variance between groups resulted in p=0.209 (n=8 wet, 5 dry). E. coli samples obtained at the effluent during wet periods resulted in a mean of 354 MPN/100 mL and 321 MPN/100 mL during dry periods; variance between groups resulted in p=0.820 (n=8 wet, 5 dry). Influent total coliform samples collected during wet periods in the summer had a mean of 13,543 MPN/100 mL, while dry samples had a mean of 10,541 MPN/100 mL. Variance between groups p= 0.537 (n=8 wet, 5 dry). Wet total coliform samples obtained at the effluent resulted in a mean of 8,671 MPN/100 mL and dry samples collected at the same location had a mean of 5,810 MPN/100 mL with a variance between groups p-value of 0.800 (n=8 wet, 5 dry).
0.15 = Normal Distribution; Student’s t-Test p<0.0001" width="270" height="155" />
difference 2,073 MPN/100 mL; Mean log difference 0.7 (0.5, 0.9) Kolmogorov-Smirnov
> 0.15 = Normal Distribution; Student’s t-Test p<0.0001
ANOVA calculations for turbidity also indicated increases during wet sampling events at the influent, with a mean of 8.45 nephelometric turbidity units (NTU) versus 5.16 NTU for dry sampling events, p=0.001. However, turbidity measurements obtained at the effluent were not significantly different, with a mean of 10.7 NTU during wet conditions and 9.2 NTU during dry conditions, p=0.450.
ANOVA calculations for conductivity indicated no significant difference between wet and dry samples obtained at the influent with mean values of 69.5 uS/cm wet and 77.3 uS/cm dry, p=0.369. However, effluent samples did indicate a significant difference with mean values of 61.0 uS/cm wet and 77.4 uS/cm dry, p=0.003.
Other Sampling Data. The number of beach closings due to high fecal coliform measurements for the years 2007 through 2013 is presented in Table 6. The city averaged five closures per year prior to the wetlands being developed and averaged 2.5 beach closures for the two years after.
232 MPN/100 mL Mean Log Difference= 1.3 (1.0, 1.7) Kolmogorov-Smirnov>0.15
= Normal Distribution; Student’s t-Test p<0.0001
Discussion
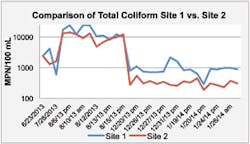
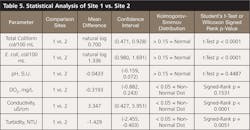
Statistical analysis of total coliform results indicates site 2, the effluent (downstream) of the Eastern Wetlands, had mean log difference of 0.7 (2,072 MPN/100 mL) when compared to site 1, the influent (upstream) of the Eastern Wetlands (Table 5). This difference indicates a significantly lower total coliform concentration assuming a normal distribution (p<0.0001; CI: 0.5, 0.9). A time series of the total coliform measurements at site 1 and site 2 are provided in Figure 4. All samples obtained during the winter months were collected during dry periods following at least 48 hours of no rain. Total coliform concentrations were generally lower during the winter months, likely due to lower temperatures (Crump and Hobbie 2005).
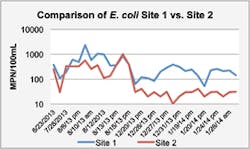
E. coli was also lower at site 2 than site 1. Figure 5 is a time series of the E. coli measurements at site 2 versus site 1, with a mean log difference of 1.3 (232 MPN/100 mL) assuming a normal distribution (Kolmogorov-Smirnov >0.15), Student’s t-Test with 95% confidence interval (p<0.0001; 1.0, 1.7). As with total coliform, E. coli concentrations were generally lower during the winter months, again likely due to lower temperatures.
Statistical analysis (Table 5) provided no evidence of significant difference in pH measurements of site 1 compared to site 2, mean difference of -0.0433 standard units (SU) assuming a normal distribution (p=0.4487). There is a noticeable change in pH following a diurnal pattern on the days that were sampled twice, most likely due to photosynthesis and respiration of aquatic plants. Aquatic plants photosynthesize during the day, uptaking carbon dioxide and thus raising the pH of the water. The opposite, respiration, occurs at night as plants release carbon dioxide into the water (Windell et al. 1987).
Site 2= 3.3 u5/cm (0.7. 6.0) Kolmogrov-Smirnov Wilboxon Signed Rank Test; p <0.0001
The comparison of DO2 of site 1 and site 2 (influent and effluent) yielded a mean difference of 0.3193, which was not statistically significant; Kolmogorov-Smirnov value <0.15, which indicates a non-normal distribution; and Signed Rank p=0.1531. A distinct diurnal pattern was apparent during days that were sampled twice, morning and late afternoon. DO2 measurements were higher later in the day. Given the temperature dependence on the ability to dissolve gas, DO2 should decrease later in the day as the water temperature increases throughout (Spiro and Stigliani 1935). Photosynthesis of aquatic plants is again the cause as oxygen is released into the water during the day and removed during nighttime respiration. However, there is a definite overall increase in DO2 during the winter months, which demonstrates the inverse relation between DO2 and water temperature dictated by the solubility of gas in water.
Statistical analysis of the difference in turbidity of the Eastern Wetlands effluent (site 2) and influent (site 1) resulted in mean difference of -1.4 NTU (-2.5, -0.4) Kolmogorov-Smirnov value <0.15, Signed-rank p-value of 0.005 indicating an actual increase in turbidity at the effluent, which was unexpected. This increase is likely due to the design of the effluent structure rather than the process of the wetlands. The effluent channel is very shallow and draws water from the floor of the wetlands, causing slight turbulence and resuspension of sediment. The influent sample point has a much greater depth and is an overflow design that allows settling of some solids.
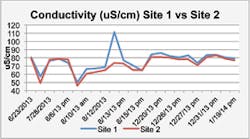
Conductivity is a general measure of stream water quality relating the water’s ability to conduct an electrical current, affected by ions of inorganic dissolved solids. Snapfinger Creek is subject to typical urban runoff whose pollutants, such as phosphorus and metals, will likely effect conductivity measurements (Horner et al. 2007). While not especially noteworthy, the difference in conductivity of the sample sites was significantly higher, statistically, compared to site 2, mean difference 3.3 uS/cm (0.7, 6.0), Kolmogorov-Smirnov value <0.15, Signed Rank p<0.0001. However, the confidence interval is somewhat broad. The time series of conductivity measurements at both sites are presented in Figure 6.
Effect of Rain on Sample Results. The Atlanta region has relatively old sewer infrastructure that was placed in the low-lying areas adjacent to streams. Thus, rainwater enters the sewer and eventually overwhelms its capacity and overflows into the creek ways. Similarly, older septic tanks can be overwhelmed and release material to the environment. Some rain events do not overwhelm these systems, but some do. Cooking grease discharged into sewers has been proven to stick and harden on the distribution system pipes, and increase the overflow of sewerage into the environment.
Increases in E. coli, total coliform, and turbidity within 48 hours of rainfall were observed at all sampling sites; however, the only statistically significant increase occurred for turbidity at influent of the Eastern Wetlands, site 1. The effluent, site 2, experienced a significant decrease in conductivity during wet weather. The decrease in conductivity during wet weather at the influent was not statistically significant.
Limitations
The relatively small sample number (n=30) was a notable limitation of the study, resulting in decreased power of the study design and increased confidence intervals. Bacteria samples in water often have a heterogeneous distribution (Edberg et al. 1990). Cluster sampling or composite sampling would have reduced this uncertainty.
While some samples were obtained within 48 hours of rain, the effect of rain was not included in the study design. Sampling throughout the course of a rain event at specific intervals could help determine a profile of the effect of rain on pollutant levels, especially important during the first flush. The use of a rain gauge located within the study area would increase precision over US Geological Survey data of nearby sites. Including measurements of flow rates at each sample site may also provide further correlations between rain and pollutants.
This study did not analyze samples for metals or oil and grease. Considering the commercial surroundings near the study site, road runoff is likely a large contributor to stormwater in the area. A determination of the metals content and possible removal by the wetlands could be beneficial in determining future use of constructed wetlands in urban areas.
Conclusions
The data support that the constructed Pine Lake Eastern Wetlands, though small, improved water quality, even though it also became the habitat for turtles, ducks, muskrats, Georgia otters, and one beaver.
Water-quality improvements included
- decreased total coliform counts,
- decreased E. coli counts,
- decreased conductivity, and
- a decrease in the number of beach closings.
Since the Eastern Wetlands have water diversion controls to allow for flow into other stormwater features, the data also provide useful wetlands management information. Rainfall appeared to be associated with increases in total coliform, E. coli, and turbidity. This study supports green infrastructure as an effective solution for challenges of stormwater management in an urban setting.
Recommendations
Because the low sample numbers resulted in statistical significance being only evident in more extreme cases, future studies should include more samples, either combined and homogenized samples, or sampling under focused conditions to determine efficacy of the wetlands elements under specific conditions.
The biodetention feature that filters street runoff before it reaches the lake deserves comparison to the other features, as it was less costly and is easier to maintain in an urban setting.
Acknowledgements
Many thanks to Kathleen Wannemuehler for assistance in SAS coding, and to Paige Tolbert, Environmental Health Department Chair, Rollins School of Public Health, for her support and coordination.
References
Bekilou, M., N. Dermirer, and E. Korkuzsuz. 2005. “Comparison of the Treatment Performances of Blast Furnace Slag-Based and Grave-Based Vertical Flow Wetlands Operated Identically for Domestic Wastewater Treatment in Turkey.” Ecological Engineering, 24: 187–200.
Brix, H. 1994. “Use of Constructed Wetlands in Water Pollution Control: Historical Development, Present Status, and Future Perspectives.” Water Science and Technology 30(8): 209–223.
Christianson, R., B. Barfield, J. Hayes, K. Gasem, and G. Brown. 2004. “Modeling Effectiveness of Bioretention Cells for Control of Stormwater Quantity and Quality.” Critical Transitions in Water and Environmental Resources Management, pp. 1–7. doi: 10.1061/40737(2004)37.
Crump, B., and J. Hobbie. 2005. “Synchrony and Seasonality in Bacterioplankton Communities of Two Temperate Rivers.” Limnology and Oceanography 50(6): 1718–29.
Dichter, G. 1990. Testing Waste Water for Fecal Coliforms and/or E.coli using Colilert and Colilert-18 and Quanti-Tray. Retrieved from www.idexx.com/water.
Dwight, Ryan H., Jan C. Semenza, Dean B. Baker, and Betty H. Olson. 2002. “Association of Urban Runoff With Coastal Water Quality in Orange County, California.” Water Environment Research Volume 74(1): 82–90(9).
Edberg, S. C., M. J. Allen, D. B. Smith, and N. J. Kriz. 1990. “Enumeration of Total Coliforms and Escherichia coli from Source Water by the Defined Substrate Technology.” Applied and Environmental Microbiology 56(2): 366–69.
Fulcher, G. 1994. “Urban Stormwater Quality From a Residential Catchment.” Science of the Total Environment, 146-147: 535–42. http://dx.doi.org/10.1016/0048-9697(94)90279-8.
Gaines, S. DeKalb County Board of Health Fecal Coliform Reports, 2007–13.
Gosselink, J., and W. Mitch. 1993. Wetlands, 2nd edition. New York: Van Nostrand Rheinhold.
Horner, R., C. May, G. Ridley, J. Skupien, and E. Shaver. 2007. “Fundamentals of Urban Runoff Management.” Technical and Institutional Issues, 2nd edition, 50–62.
International Stormwater. 2012. International Stormwater BMP database. Water Environment Research Foundation. Accessed September 10, 2013. www.bmpdatabase.org.
Koob, T., M. Barber, and W. Hathhorn. 1999. “Hydrologic Design Considerations of Constructed Wetlands for Urban Stormwater Runoff.” Journal of American Water Resources Association 35(2): 323–31.
Langeveld, J. G., H. J. Liefting, and F. C. Boogaard. 2012. “Uncertainties of Stormwater Characteristics and Removal Rates of Stormwater Treatment Facilities: Implications for Stormwater Handling.” Water Research 1–13. http://dx.doi.org/10.1016/j.watres.2012.06.001.
Ledbetter, G. 2012. “Opposition to Chadron Storm Water Project Surfaces.” Chadron Record. April 12, 2012.
Lee, J. H., and K. W. Bang. 2000. “Characterization of Urban Stormwater Runoff.” Water Research 34(6): 1773–80.
Lee, J. H., K. Bang, L. Ketchum, J. Choe, and M. Yu. 2001. “First Flush Analysis of Urban Storm Runoff.” Science of the Total Environment 293: 163–175.
Li, L., C. Yin, Q. He, and L. Kong. 2007. “First Flush of Storm Runoff Pollution From an Urban Catchment in China.” Journal of Environmental Sciences 19(3): 295–99. http://dx.doi.org/10.1016/S1001-0742(07)60048-5.
Manhard Consulting Ltd. 2007. Conceptual Designs for the Pine Lake Wetlands System. Proposal for EPA 319 h grant and American Recovery and Reinvestment Act grant.
Maryland Stormwater Design Manual Volumes I & II. 2000. Section 2.7, BMP Group 3 (Infiltration), and BMP Group 4 (Filtration). www.mde.state.md.us/assets/document/sedimentstormwater/Introduction.pdf.
NOAA. 2013a. July–December 2013 National Climatic Data Center. Precipitation. Retrieved from www.ncdc.noaa.gov/sotc/service/national/Statewidetrank/201301-201312.gif.
NOAA. 2013b. July–December 2013 Regional Ranks. National Climatic Data Center. Precipitation. Retrieved from www.ncdc.noaa.gov/sotc/service/national/Regionalprank/201307-201312.gif.
O’Dell, J. 1993. Method 180.1 Determination of Turbidity by Nephelometry Environmental Monitoring Systems Laboratory. Office of Research And Development, US Environmental Protection Agency, Cincinnati, OH.
Spiro, T., and W. Stigliani. 1935. Chemistry of the Environment, 3rd edition, Mill Valley, CA: University Science Books 2012.
Styes, K. R. 2014. Determining the Efficacy of a Constructed Wetlands as a Water Quality Improvement Strategy in an Urban Environment. Masters Thesis. Emory University, April 2014. http://pid.emory.edu/ark:/25593/g1db5. Accessed November 13, 2014.
Sullivan, K. M., A. Dean, and M. M. Soe. OpenEpi: Open Source Epidemiologic Statistics for Public Health, Version 2.3.1. www.openepi.com, updated 2011/23/06, accessed April 13, 2014.
USEPA. 2005. Criteria and Procedures Quality Assurance, 5th edition. Manual for the Certification of Laboratories Analyzing Drinking Water. www.epa.gov/ogwdw/methods/pdfs/manual_labcertification.pdf.
USEPA. 2005. Standard Methods for the Examination of Water and Wastewater, 21st edition. #9223B Enzyme Substrate Coliform Test, Colilert.
USEPA. 1993. Subsurface Flow Constructed Wetlands for Wastewater Treatment: A Technology Assessment. US EPA Office of Water, EPA 832-R 93-008.
USEPA. 2012. Water: Monitoring and Assessment, Water, Our Waters, Rivers & Streams, Monitoring & Assessment, 5.9 Conductivity, “What Is Conductivity and Why Is It Important?” Retrieved from http://water.epa.gov/type/rsl/monitoring/vms59.cfm.
USGS. 2014. Snapfinger Site Number “02203950 Snapfinger Creek Near Decatur, GA, DeKalb County, Georgia; Hydrologic Unit Code 03070103; Latitude 33°45’48,” Longitude 84°13’13” NAD27. Retrieved from http://waterdata.usgs.gov/nwis/uv?site_no=02203950.
Windell, J. T., L. P. Rink, and C. F. Knud-Hansen. 1987. A One Year, Biweekly, 24-Hour Sampling Study of Boulder Creek and Coal Creek Water Quality. Aquatic Wetland Consultants Inc.
Wong, T., and P. Breen. 2002. “Recent Advances in Australian Practice on the Use of Constructed Wetlands for Stormwater Treatment.” Global Solutions for Urban Drainage, ed. E. W. Strecker and W. C. Huber.
Woolson, E. 2005. “The Price of a Utility.” Stormwater 6(5).
Zarus, G., and P. Howland. 2012. Pine Lake’s Wetland: A Constructed Urban System. Georgia Soil and Water Conservation Commission, DeKalb Expo. Atlanta, GA. May, 26 2012.
Zarus, G., P. Howland, and M. Gazaway. 2006. Enhancing Habitat While Treating Stormwater Runoff in a Small Urban Lake. North American Association of Lake Management. Annual Meeting. Macon, GA. January 2006. www.researchgate.net/publication/215624921_enhancing_habitat_while_treating_stormwater_runoff_in_a_small_urban_lake_watershed?ev=prf_pub.
