Keeping an eye on the temperamental moods of Mother Nature has come a long way from the windsock, thermometer, and rain gauge. Today, engineers, researchers, and environmental managers have an array of equipment that might be dubbed the poster-children of multitasking: digital testing and monitoring tools that can be programmed for function, timing, and reporting, and test kits so simple a child can use them, have taken the place of everything old school.
Fast-Tracking Plans in Response to a Crisis
One of the highest-profile water monitoring events in recent history occurred on Lake Erie in August 2014. Nutrients in runoff caused an algal bloom that temporarily cut off the drinking water supply for the city of Toledo, OH.
Fondriest Environmental provided critical monitoring instrumentation for Ann Arbor, MI-based LimnoTech Environmental Consulting during that event. Helping to understand the long-term trends in nutrient runoff and harmful algal blooms that are the bane of the western basin of Lake Erie is a work in progress at LimnoTech, but the company’s fast action earned the grateful thanks from the city of Toledo in 2014.
In the spring of 2014—before the crisis—the city planned a research project that would test the water quality in the lake and keep an eye on the bloom using a variety of instruments. “The idea was to get it online midway through the season and test its ability. We didn’t know what kind of data we would see, but we knew it was a good project,” says Ed Verhamme, a project engineer with LimnoTech.
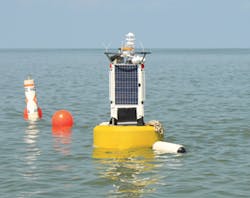
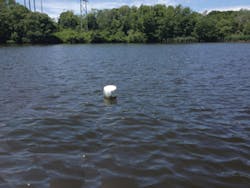
The buoy is located on Lake Erie, 100 feet from the intake.
“We were focusing on the cause of the problem—how do we monitor the effect of harmful algal blooms, the runoff, and that bloom the lake leads into Toledo’s system. They [the city] had very little data to support their water treatment plant, and we created watershed models on quantifying the source contribution,” explains Greg Peterson, a LimnoTech vice president. “One thing on the stormwater front is knowing how urban stormwater fits within the total pie, and really understanding the source and how much of the phosphorous load goes into western Lake Erie contributing to bloom.” He says the data collected from monitoring help quantify the runoff through tributaries and the urban stormwater load, which is then valid ammunition to speak to regulators to “prevent this problem from happening.”
However, by the end of July, a severe bloom affected Lake Erie, and toxic microcystin exceeded safe water levels in the city’s finish water, forcing the shutdown of Toledo’s water supply.
“The water treatment plant took the contract for this project to the mayor who signed it immediately, on August 4, and allowed a fast track to implement the monitoring,” says Paul Nieberding, general manager of Fondriest Environmental. Fondriest Environmental is a distributor and manufacturer’s representative for Yellow Springs Instruments (YSI), outside Dayton, OH.
Monitoring, Measuring, Modeling, and Sharing
Unlike many water intakes, Toledo’s intake is above water, 4 miles out in Lake Erie. By Thursday, August 7, LimnoTech had installed a buoy 100 feet from the intake that was equipped with a meteorological station measuring air temperature, humidity, barometric pressure, wind speed and direction, solar radiation, and water quality—all from a single location in real time. This had never been done before.
Nieberding says that the YSI EXO total algae sensor is the most crucial instrument onboard the buoy. “This sensor is tuned to the wavelength of blue-green optical response, so it can measure both chlorophyll-a and phycocyanin, the pigment in the toxin-producing blue-green algae.”
Live data from the sensor can give operators back at the plant an idea of algae levels at the intake before the water gets to the plant, and they can then prepare a plan to modify treatment.
“At the treatment plant, they would eventually see those water-quality trends, but the time from when the water enters the intake crib until they measure it in the plant can be up to 24 hours lag time,” explains Verhamme. The instrumentation on the buoy, he says, lets them see “What’s the quality of the water coming into our intake right now?”
He adds, “We also outfitted the buoy with a video camera that took video clips and transmitted them remotely to provide a visual of how the water looks, every hour. Below the buoy we had an ADCP—an acoustic Doppler current profiler—that measured water velocity and waves, but this was removed in October before winter set in.”
All the observation data, Nieberding explains, traveled through a single modem-driven data logger and through the Internet via Verizon phone lines to the Michigan-based LimnoTech. Data were updated about every 10 to 20 minutes.
“Operators use the data to help inform the appropriate chemical dosage to add to treat for Microcystin, as well as to know when to decrease treatment because the bloom intensity has decreased,” explains Verhamme. The information also helps National Oceanic and Atmospheric Administration (NOAA) researchers, who use the real-time observations from the sensors to know when and where to concentrate targeted boat sampling of the bloom during weekly boat trips out on the lake.
He says reports from the real-time sensors are integrated with modeling, and this is key to immediate and long-term decisions. “The sensors read all the time at a fixed location and can’t get what’s happening in the in-between places, between sensor A and sensor B. The model simulates conditions at areas we haven’t sampled during times when we can’t be on water.”
The modeling “represents our best scientific estimates of how the ecosystem operates and is the underpinning of decision support to answer questions about what other management practices need to go into place.”
Andy McClure, administrator of the Collins Park Water Treatment Plant in Toledo, says the monitoring and sensor program is a major factor in responding to algae. “Part of the problem is that testing for Microcystin takes four hours, but the monitors and sensors on the buoy give us indicators that there might be a problem. So instead of us being reactive to changes, we can be proactive and adjust treatment based on the data coming in.”
The monitor and sensor data are posted on websites that other plants downstream can see and alert them to prepare for changes in their treatments as well.
“It’s really invaluable,” says McClure.
Nieberding describes the historical genesis of the company. “YSI has been around since the ’60s, and one of our cofounders was Leland Clarke, the inventor of what is now known as the Clarke electrode, a device that originally was developed to measure oxygen in open heart surgery.” The company’s equipment offerings grew, and today its sondes—sonde is the French word for probe—are deployed in numerous water measurement locations.
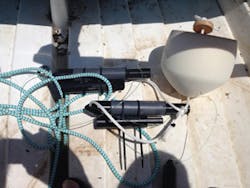
“Our sonde is a cylindrical unit about 24 inches long and 3.5 inches in diameter equipped with multiple sensors. It measures temperature, conductivity, dissolved oxygen (DO), turbidity, cycocyanin, and chlorophylls,” says Nieberding. In addition to water-quality instrumentation, the company has meteorological stations that measure air temperature, humidity, barometric pressure, wind speed and direction, and solar radiation.
Verhamme of LimnoTech describes his company’s efforts to monitor and protect watersheds around the US and the world. “This is our 40th anniversary this year,” he says, “and our focus is an integrated, high-end approach to solving the nation’s largest water resource issues, the quantity and quality side.”
He notes that the surge in environmental awareness in the 1970s coincided with the advent of the fledging computer industry. Both events sparked a group of University of Michigan researchers to get involved and forge a pathway toward understanding and solving the nation’s water problems. Since then, Verhamme says, environmental legislation has controlled many of the waste and discharge problems, but the issues involving stormwater runoff bringing pollutants to water bodies is one of LimnoTech’s front-burner consulting services.
“We are working on projects coast to coast using math models to simulate natural water systems to evaluate water quality—the impacts, the sources, and the causes. It’s a process to understand first the source of the problem, the cause of that particular problem, its impact on the system, and then the solutions.”
Verhamme says monitoring and data are needed to calibrate the mathematical models. “To help clients, we use computer statistics to integrate the data from field sources.”
Peterson describes recent work in the lower Michigan peninsula, including bacteria sampling “as it relates to stormwater, agricultural, and septic. We’ve been involved in wet-weather programs, stormwater monitoring for municipalities’ sewer overflows, and the impact on rivers.” He also notes that the company’s work with the Great Lakes Observing System (GLOS) involves a vast array of observing and monitoring systems.
The HOBO That Sleeps for Five Minutes
In 1981, Lon Hawker, an innovative Massachusetts Institute of Technology graduate, began experimenting with new technologies and developed a small, self-contained, autonomous data logger that was battery operated, wireless, and complete with a microprocessor and a memory. These first experiments in a Falmouth, MA, barn eventually led to the launch of Onset Computers, which now operates out of a 40,000-square-foot manufacturing facility on Cape Cod. Herman Gustafson, product marketing engineer at Onset, explains the unusual naming of products.
“Lon was enamored of trains and all train lore, and he named his first product the HOBO logger. His analogy was that a hobo is a transient—he hops off a train, looks around, and then leaves. People use our products in a similar fashion. They’re self-contained, and you put them in a location to observe and measure, and then they’ll be retrieved for use in another location.”
Although Hawker has since retired to Hawaii, the company continues to grow and develop products for diverse monitoring and sensing applications. Gustafson says they are used globally to test performance and measure environmental data.
“These tools are infrared technology that is low power, and we also write software that allows the customer to interact with the equipment. So, for example, you can have a bunch of these data loggers on your desk, and you configure them in your office—the software allows you to program them automatically—then you can put on your boots and go out and place them underwater with the mounting. They’ll wake up and take the measurement at whatever interval it’s configured, the sensors record the data, and then they go back to sleep.”
Customers can leave loggers in place for weeks, months, or years, Gustafson says. Once they are retrieved, the customer can plug them into a computer and offload the data. “The software allows you to plot the data as an x, y grid of values over time, or as Excel spreadsheet.”
The data loggers are used in a host of monitoring scenarios including academic–“Almost every major university and college has one,” says Gustafson—by government agencies such as the US Geological Survey, the Department of the Interior, and the US Department of Agriculture, “and in studies in far-flung places such as coral reef monitoring in the Seychelles off southern Africa, the Pacific islands of Micronesia, and the Caribbean.” But one customer is literally in Onset’s backyard.
Cedar Pond
How Much Salt Do You Want in Your Water?
Research scientist Amy Costa, Ph.D., director of the Cape Cod Bay Monitoring Program, uses HOBO loggers for her Cedar Pond research, an important initiative of the Center for Coastal Studies, headquartered in Provincetown, MA.
“This is our tenth year monitoring the water quality of Cape Cod Bay,” says Costa. “Between our work in Cape Cod Bay and Nantucket Sound, we collect data from more than 150 stations offshore and along the shoreline of Cape Cod and the islands, looking at trends estuary by estuary, to evaluate the impacts of stormwater, wastewater, and contaminants as part of a larger plan to protect aquaculture and keep our coastal waters clean.”
Costa describes how the HOBO data loggers play a key role in the Cedar Pond monitoring, one of the featured projects of the bay monitoring program. Situated within the town of Orleans, Cedar Pond today is roughly 15 acres—”Part of it was filled in the early to mid-1900s during the construction of Route 6,” says Costa—and it has been highly impacted by development. Additional modifications to the Cedar Pond-Rock Harbor estuary system include increases in residential and commercial buildings, the building of overhead power line structures, and the deterioration of tidal dikes that prevent inflow from Rock Harbor, causing increased salinity.
“Cedar Pond has a unique history in that it was originally considered by the town to be freshwater, supplied by groundwater inflows, but the increasing tidal exchange with nearby Rock Harbor has had dramatic effects and changed the pond from fresh or brackish to a coastal salt pond.”
Costa says the objectives of the Center’s study of Cedar Pond and Rock Harbor estuary were to learn the conditions of the waters, to study the levels of nutrients and contaminants and where they were coming from, and to determine how the changes from fresh to marine status affects water quality.
The first two years of the study involved monitoring at the mouth of Rock Harbor, in Rock Harbor Creek, in the Dyer Prince tributary, at the culvert connecting Rock Harbor Creek to Cedar Pond, and within Cedar Pond itself.
Data Logger Reporting—Change Can Be Good!
In a January 2014 presentation of findings to local policymakers and concerned groups, the researchers reported they found “a decline in water quality from the well-flushed mouth of the estuary toward the headwaters. Samples taken near the mouth of Rock Harbor typically had low levels of nutrients and chlorophyll, good water clarity, and healthy levels of dissolved oxygen. However, the farther upstream the sample was taken, particularly in Cedar Pond itself at the head of this system, the waters were badly degraded, especially during the summer months when the water column was stratified. The bottom waters had high levels of total nitrogen and total phosphorous and very low levels of dissolved oxygen, characteristic of a highly eutrophic system.”
As higher-salinity water from Rock Harbor Creek continued to enter Cedar Pond over the course of the third field season of the study, salinity in the pond increased enough to break down the stratification. Notably, this occurred with the decrease in water temperatures. “Once this occurred and the water column mixed, changes in water-quality parameters were striking. Dissolved oxygen increased dramatically and nutrient levels dropped.”
HOBO equipment is used to monitor the 15-acre Cedar Pond.
Costa says that although the data were complex, “We saw that as the pond became more of a marine environment; the mixing between fresh and saltwater was bringing improvements in the ecosystems as salinity increased. One of the big fluctuations we saw from the data loggers was the episodic changes in temperature, salinity, and DO.”
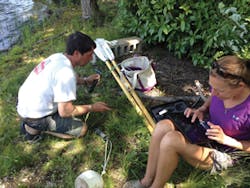
Before the researchers began using the data loggers, Costa says, they would go out and take measurements with a handheld device every two weeks, “but it didn’t catch the fluctuations, especially the DO, and we were really missing a lot.” The HOBOs were placed at specific locations and programmed to record temperature, salinity, and DO every five minutes, which detects the most minute changes, and when plotted against time and compared to other trends, the logger data give a very accurate picture.
The study has also found that a direct source of nitrogen from a parking lot catch basin and a pipe that drains an adjacent marsh was contributing a significant amount of nitrogen to the estuary. Solutions to this problem and to wastewater treatment issues are being debated, alternating between what Costa describes as “the big pipe route” and use of other methods such as aquaculture as a natural, less-invasive filtering system.
The Challenges of Mother Nature
Human interventions and the effects of climate change affect all water features of the entire cape, placing demands for more stormwater and wastewater controls on the already overloaded plates of municipalities, but when Nature herself creates unanticipated problems, the solutions take on a different dimension beyond which pipe to use. Costa describes how the utility wires that pass over Cedar Pond have become a roosting spot for daily populations of up to 600 migratory cormorants, whose “daily dump” is a huge contaminant concern.
“The town of Orleans has tried noise to drive them away, which disturbed residents more than the birds. Nothing so far has worked in forcing them away, and it would cost millions to run these electrical lines underground, so it’s one more stress on the pond we have to think about.”
The big controversy that now surrounds the future of Cedar Pond is whether it should be allowed to continue its trend toward becoming a marine, saltwater environment, or whether barrier structures should be erected that will keep the saltwater out and force the pond to return to a freshwater state. Costa is urging policymakers to look at the new data the researchers have collected and analyzed as the latest science on which to base their decisions.
“They were using 10-year-old information to make important decisions about this system, which is why our collection from this monitoring is so critical as science-based, statistically valid data. We’ve told the town that as more mixing occurs in the ecosystems, you can’t really go back [to freshwater], and they did agree to incorporate more recent data from our studies in their decision process.”
The monitoring program, Costa affirms, “is definitely going to continue, as we have over 150 stations to track trends all over the coastal waters of Cape Cod and the islands. But, if we want to get the town to vote the money to pay for what needs to be done, we need to continue outreach and education, as this is one of the most overlooked components in the programs. They need to understand what’s happening out there.”
A Test Kit That Teaches Awareness
Five hundred miles away, at the southernmost end of the Chesapeake Bay, education and outreach is in full swing on the James River, and CHEMetric Inc. testing equipment is being used to teach the lessons. Environmental educator Eric Wiegandt of the Chesapeake Bay Foundation (CBF) could not be more enthusiastic.
“Here at the tidal James River near Richmond, Virginia, we’re one of about 15 education CBF programs across the bay. Our goal is to educate young people, teachers, and educators about the importance of the bay watershed and the importance of water quality, plus we talk about how humans impact water and the surrounding wildlife,” he says. Each year the program serves a combined audience of about 35,000 students across the Chesapeake Bay; 2,000 of those participants take part in Wiegandt’s James River program.
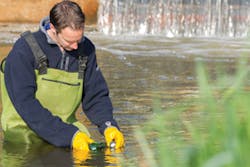
He teaches awareness concepts with a hands-on approach by having students gather the field samples and perform the tests onsite using water testing equipment from CHEMetrics.
Joanne Carpenter, research and development director for Virginia-based CHEMetrics, says Wiegandt is using the same test kit product used in stream monitoring and other surface water projects associated with stormwater and water-quality assessments.
“This particular test kit is a vacuum-sealed ampoule, and the beauty of it is it can be used by anybody—you don’t need a chemistry degree and you’re never handling, pouring, or measuring any reagents or other chemicals.”
Carpenter says anyone involved with water analysis can select this or other convenient “snap-and-read” test kits from the company’s comprehensive list of 45 analytes to meet specific water testing needs. From alkalinity to zinc—literally an A to Z list—CHEMetrics tests can detect and measure pH, chemicals, metals, total dissolved solids, turbidity, phosphates, dissolved or chemical oxygen, and much more. She says millions of these tests are being used around the world in a variety of markets such as industrial water treatment, manufacturing, environmental monitoring, municipal water quality, food processing markets, and many others.
Learning While Doing Aboard the Baywatcher
Wiegandt says his students love doing these tests, which are the perfect tool to illustrate his educational objectives.
“A typical day is about four to six hours,” he explains. “We take students out on our 42-foot diesel-powered deadrise boat called the Baywatcher, and after a safety briefing we travel about four or five miles each way. We talk about water quality, and the impact of humans on water quality, and then we stop and do some testing: nitrates, phosphates, dissolved oxygen, pH, turbidity, and salinity.”
He appreciates the ease of use of the CHEMetrics test; the phrase “so simple a child can use it” could not be more appropriate in this case.
“The low-pressure ampoules are sealed with the reagent inside, so when you stick that glass ampoule in the test tube, the tip breaks off and the pressure equalizes and sucks up the sample.”
Cedar Pond
The reaction occurs inside the ampoule, and students can then use a comparator and read the results. “Collecting organisms and water testing is their favorite part of the trip,” he says.
The field location on the river, Wiegandt says, is in an area of mixed industry and agriculture, but “in the part of the river we are working, we don’t see major pollution. It’s tidal, and it’s [water] used by industry for processing. In fact, we do most of our testing surrounded by wetlands.”
The students talk about numerous environmental issues during the testing. “We talk about the sources of stormwater as one of the focuses of our discussion. I think they just think it’s rainfall and they’re not sure where it goes, or if it’s treated or not treated. We are encouraged to talk about stormwater as a source of pollution that has not gotten enough attention in the past, especially with urban audiences, so we are trying to address that.”
Nonetheless, over the 14 years he’s been doing this, he has seen growing awareness. “Young people are as aware of water-quality issues as adults. I’m hoping this is becoming a topic being discussed more in schools.”
Starting Early to Ensure Appreciation of the Environment
Few would argue against promoting awareness of important environmental challenges to create a sensitive mindset in young people—the future voters and decision makers on these issues—as an essential piece of their education. To foster that process, Wiegandt says, the program offers a multi-day option for teachers, who can earn recertification and graduate-level credit by taking these courses in the summer.
“I do the same program with the teachers as with the students, and if we can indoctrinate the teachers, it encourages them to get their students out there, too. I love this job. I hear so many times from students, ‘This is the best field trip I’ve ever been on!’ and that’s great to hear.”
The pervasive nature of stormwater and its role in any individual watershed is subject to multiple influences, but almost always involves humans to some degree. The effects can be close to home or part of a larger environmental scenario, but one thing is certain: monitoring the waters is essential. Whether data are collected in real time or on a programmed schedule, thanks to the digital age and wireless technology, the day-to-day (and sometimes hour-to-hour) window into the real dynamics of these water bodies is now possible.