As water utilities face higher production costs, detecting and repairing leaks has grown in importance. Whether the cause is scarce resources from a drought, higher prices for electricity, or the costs of treating water that never reaches the customer, utilities can’t afford the losses of revenue from leaks. But leaks can be large or small, and their locations may be spread out over hundreds of miles. With aging infrastructure and complex distribution systems confounding matters, how can a utility identify and prioritize their most urgent leaks? Actually, it’s not that difficult. From regional AMI systems to simple flow meters, there are a variety of options, and we’ve got the experts ready to explain how to get results. Fast. Now, let’s see what’s available.
Point of Use
A drought can hit a utility’s budget hard, so Neptune Technology Group Inc., Tallassee, AL, recommends a two-pronged approach that leverages point-of-use leak detection and data logging capabilities. According to John Parks, Neptune’s director of new business development, point of use leak detection is a function of the Neptune E-Coder and R900 or R450 meter interface units (MIUs) and it’s integrated with the E-Coder register or connected via a cable. To accommodate legacy equipment, the E-Coder’s radio-integrated version—or theversion with a separate radio—can be easily retrofitted to an existing Neptune meter in the field.
“For detecting leaks on the residential side, Neptune offers a solid-state encoder,” says Parks. “The technology divides a 24-hour period into 96 15-minute intervals, detecting flow in those 15-minute periods. The E-Coder uses this interval data to determine if there’s a continuous or intermittent leak at a residence, and it is extremely accurate. If there’s flow in all 96 15-minute intervals, there is obviously a continuous leak on the residential side of the meter. Intermittent leak examples are faulty flapper valves in the toilet, or a sink shut-off valve that doesn’t tighten up enough and continues to drip.”
With the leak identified, a utility can use customer information system software to automatically notify customers, without any interaction by the utility staff. Neptune’s N_SIGHT host software can send e-mails or texts to alert customers, and they can also be notified of leak conditions via their billing statements. Results are fast. If the utility has a fixed network, leak condition flags can appear within 24 hours. With mobile read systems, utilities won’t see leak condition flags until they read the meters and download the data to N_SIGHT.
“The N_SIGHT host software suite can be onsite or hosted via a software-as-a-service model, and it’s user-friendly,” adds Parks. “It can be navigated efficiently following a short implementation/training session. The software provides residential leak detection in graphical and tabular formats. The host software retains two years of data so leak detection information and history can be analyzed and compared over time. For distribution line leak detection, our N_SIGHT host software, using our fixed network system architecture, has the ability to providedistrict metered area analysis. The system takes a snapshot in time of the system and districts and compares water pumped versus water billed, to identify distribution line leakage and assist in targeting locations. Distribution line leak detection can also be determined by the deployment of acoustic leak sensors with Neptune radio MIUs. The data can be collected by Neptune meter reading technologies and displayed in reports in N_SIGHT.”
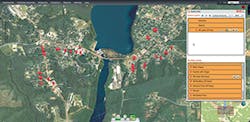
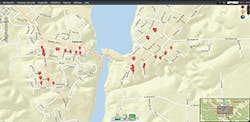
To add further automation to the system, a utility can combine Neptune E-Coder data, N_SIGHT software, ESRI geospatial mapping, and Cityworks, so water leaks can be detected. Then, the locations are identified and mapped out, and work orders are generated.
Neptune combines geospatial mapping with its E-Coder data and N_SIGHT software for easy leak detection.
Pressure
When looking at the features of an AMI system, utilities should consider the benefits of pressure management analytics, says Joe Ball, director of water solutions marketing for Itron, Liberty Lake, WA. “A pressure management system can be helpful because some utilities have an issue with pressure zones,” explains Ball. “It’s tough to maintain a perfect pressure when there could be issues such as elevation and demand on the network. So the pressure has to be monitored throughout the day. But some utilities end up running the pressure at a higher rate, and it’s very hard on the network infrastructure, especially if there are leaks and cracks. The pressure fluctuates throughout the day and it puts a lot of strain on the network. And it increases the potential for larger leaks.”
Itron’s system allows for pressure monitors and sensors at multiple sites in a pressure zone, and features a control mechanism that analyzes existing pressure and adjusts the controls to optimize the pressure throughout the day. Ball adds, “In the past, you had to send a workman out to take a pressure reading. But today you can utilize sensors to tell you the pressures from the AMI network, and you get much more frequent data in a granular format. So instead of just saying we need a certain pressure for that critical zone, the analytics can tell you that you don’t have to keep it that high. It monitors pressure fluctuations and helps save the infrastructure.”
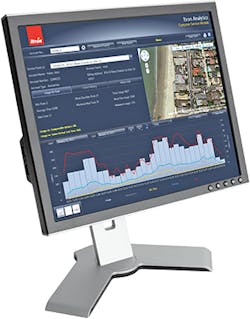
With Itron’s analytic solution, a utility can group all of the customers in a district into a pressure zone and compare the consumption at their meters, with the amount of water running through the district meter. Acoustic leak sensor data can be added, so if there’s a district that has a variance, the additional data can pinpoint potential distribution leaks in that particular district. The results of the comparison is to identify leaks and the volume of lost water, so the utility can prioritize their maintenance strategy.
Depending on the size of the utility’s service area, setting up an AMI system with all the features of leak detection and pressure zone reading could appear fairly daunting, but it can be done in manageable steps. “You can do it during the AMI install with just a port on the communication module because it will identify the leak sensors and start recording the acoustics every 22 1/2 minutes, and it sends that data to the software,” says Ball. “It’s very powerful, especially for utilities such as those in California where all the restrictions and mandatory reductions have been put in place and both distribution and meter leaks are a way to grab some low hanging fruit.”
Itron’s leak detection analytics can compare usage of all of the customers within a given district.
Standalone Systems
For those utilities that want leak detection, but are struggling with limited funds, there are standalone leak detection systems. For example, Rockdale County, GA, deployed a leak detection system from Fluid Conservation Systems, Milford, OH, and discovered 50 leaks in their first year of using the system. Rockdale County Water Resource maintains over 600 miles of water mains and 3,100 valves, to serve 27,000 connections. The county’s unbilled water rate was 34%, before it purchased a system consisting of 370 Permalog+ acoustic leak noise loggers, a Patroller II drive-by data collection device, a TriCorr real time leak noise correlator, a SoundSens “i” advanced correlating logger system and an X-Mic ground microphone. The system analyzes sound from water lines for leak noise, and transmits the data to mobile collection units to pinpoint underground leaks to minimize repair time and cost. Rockdale Water and Sewer Systems staff also completed extensive product training to ensure proper operation.
Rockdale officials estimated that the 50 leaks were responsible for the loss of over 248,000 gallons of water per day. At a cost of $1 per 1,000 gallons of water, the new leak detection program already saved Rockdale County over $90,000 per year. In February of 2015, Fluid Conservation Systems added secondary validation to its PermaNet leak detection system. The new PermaNet+ gives operators three secondary options to check for false positives prior to team deployment.
Flow Metering
Many utilities are turning to flow meters as another effective tool in discovering leaks. For example, McCrometer, Hemet, CA, offers its FPI Mag Flow Meter, as a solution for both industrial and municipal water treatment systems. It boasts an accuracy of ±0.5%, and equally important, it installs without cutting pipe, welding flanges, de-watering lines, or interrupting service. Flow meters are finding wide acceptance in a variety of industries, such as agricultural irrigation, municipal/industrial water and wastewater, oil and gas, and institutional facilities. But the company has seen much growth in the area of metering city water mains, according to Dan Hardin, regional sales manager of the municipal water market for McCrometer.
“Customers are installing the flowmeters throughout their cities on water mains,” says Hardin. “Let’s say they’re pumping 1,000,000 gallons of water into the system and they have several districts and homes and businesses with water meters that are collecting the usage. For leak detection, they will install our meter for each district, and compare their meter reads from the homes and businesses to see if they have a certain percentage of water loss. Usually the older sections of town have water losses sometimes as high as 40 to 50%. Leak detection is very important because it’s lost water that the utility can’t bill for, yet they’re still paying to make the water, clean it, pump it, and deliver it.”
Compared to the typical full scale water mains meter, McCrometer products can save time and labor on installations. “Next to a large commercial mag meter weighing 500 pounds, installation is an entirely different process,” says Hardin. “It doesn’t require a crane and three or four guys, and you don’t have to shut the line off. Basically you put a saddle around the line and drill a 2-inch hole, then put in the insertion meter. The other unique aspect of the product is that if anything goes wrong with it you can simply pull it out and shut the valve. Whereas with a with a larger meter, it’s a huge complicated project.”
Customer Side Leaks
What about the leaks that happen on the customer’s side? When water was cheap, and sustainability didn’t have its own page in a corporation’s annual report, companies and institutions didn’t put a high priority on water losses. But that has changed, says David Taylor, chief of operations at WaterSignal, Alpharetta, GA.
“We’re seeing quite a bit of pick up on the commercial and school side,” says Taylor. “We look at school systems and that’s where there’s a lot of future growth. On the commercial side, we have a cooling tower graph that allows customers to compare their makeup usage to their blowdown usage. On a cooling tower the cycles of concentration have to be at very specific levels to maximize the efficiency, and also to determine how much water and chemicals you’re putting in. The data we’re collecting allows you to diagnose the cooling tower and determine its operations and efficiencies, so you can maximize your water and chemical consumption.”
Taylor also sees customers benefitting by applying for sewer adjustments at the end of the year, based on the water that didn’t enter the sewer. For example, during a cooling tower blowdown there is evaporation and loss, and because that water doesn’t go down the drain, a company can apply for a sewer credit to their water utility.
Multi-family apartment owners can also benefit. Although a utility can meter and monitor the overall water usage of a building, owners have to be concerned with water usage and leaks within individual units. “We see a lot of copper pipes bursting on the multifamily side in winter, and we have our technicians on standby to monitor and alert customers. Owners can analyze the character of leaks and break the data down to look at it hour by hour, and see if an apartment unit is using water during early morning hours when it shouldn’t be,” says Taylor. “Also, they can benchmark usage to apartments of similar size and see if the ranges are within the range what it should be at a certain time of day.”
Leak detection and conservation is a growing concern for the pharmaceutical companies and laboratories, adds Taylor. “If you look at laboratories, they use water for their processes sometimes 24/7, and the industries that we work with have identified the usage of specific departments to see if they can cut back. The data highlights where they can trim the fat on the water usage.”
For simplicity, WaterSignal’s products are designed for access through the company’s cloud network. The products are also easy to install. “We designed the system to be a simple installation with the idea that a lot of our customers want to do a self-install,” says Taylor. “Our new Generation Six device will have lithium ion batteries. It uploads the data once a day between 3 and 4 a.m., and if there’s excess usage or consumption above the thresholds set for hourly and daily consumption, the system will upload the data for seven hours worth of data so the customer can see what transpired up until the point of the leak in a system. They can see the severity of the leak and if repairs have been effective, and the alerts continue hourly until the issue is rectified.”
As an example of effective data analysis, Taylor notes the efforts of a national chain of car washes, where the customer captured the amount of water they used at each car wash each day, and the total number of cars washed. The data revealed the number of gallons per car per day, and the company maximized their efficiency.
Landscape irrigation is another industry where data analysis can make a difference. Taylor says it’s not unusual to find that irrigation systems are using up to 50% more water than needed. “We show the property owners the hour by hour usage and they can compare it to the surface area and how much water they should be putting on the ground. Typically, there’s an immediate reduction in water usage. Irrigation systems are kind of out of sight, and out of mind on automated systems, and many times you have broken pipes and sprinklers, or issues that are not seen, so this software can help determine if there is damage or overwatering.”
WaterSignal can track weather data for properties based on the ZIP code, and show the property owner’s precipitation data. An analysis of water usage can reveal problems with rain sensors and irrigation controllers.
Fixed Networks
Now that we’ve looked at a variety of solutions technologies for both the utility and private sectors, let’s circle back to AMI systems and make note of two important benefits of fixed networks. First, utilities are finding that the data collection features of AMI systems provide accurate information for meeting government auditing requirements (see sidebar). Moreover, the industry is moving towards sharing data, as evidenced by last year’s AWWA conference, “The Open Water Data Initiative–Unifying Water Data for the Nation.” The conference was a collaborative effort of the AWWA, the White House Climate Data Initiative, the Federal Geographic Data Committee, and the Advisory Committee on Water Information. The Initiative aims to integrate fragmented water information that is already being collected by different agencies at several levels of government, and gather it into a connected, national water data framework.
Second, AMI networks are designed with multiple levels of redundancy, and during a natural disaster, these systems have helped utilities continue their operations and boosted recovery times considerably. For example, in October 2012, when Hurricane Sandy steamrolled across the East Coast, much of New York City was under water and flooding disabled many points of the city’s infrastructure. Yet, The New York City Department of Environmental Protection’s Star Network, an AMI system installed by Aclara, Hazelwood, MO, remained in service, despite the loss of power to a number of data collector units (DCUs). Aclara credits the system’s high level of redundancy, which allowed the undamaged DCUs to back up the damaged units, and continue collecting data from the thousands of meter transmission units installed throughout the city.
Leak detection and customer status also benefitted. With the system still functioning, utility engineers analyzed the data to find leaks, and areas of zero water usage, because those could indicate areas that were evacuated. The utility also looked at the data and found residences that had an abnormally high rate of water consumption after the storm, indicating possible damage to a specific property. Both the utility and its customers benefitted, but ultimately, it doesn’t take a natural disaster to see the benefits from leak detection. Stopping the costly waste of water and its impact on the environment are equally important to utilities. Isn’t it time to take a closer look at these technologies?
AMI Data Helps Audits Meet Government Standards
In the information age, audits are becoming the norm, and collecting data from AMI is one of the surest ways to meet standards that include leak and lost water data. For example, the Delaware River Basin Commission (DRBC) revised the provisions of its Water Coderegarding efficiency for water suppliers. The revisions require submittal of an annual AWWA/IWA water audit from the 600 water utilities in its jurisdiction. The DRBC oversees water resources for the longest undammed river east of the Mississippi River in the United States. Members include the states of New Jersey, Pennsylvania, Delaware, and New York, as well as the United States Army Corps of Engineers.
The DRBC requires its members to use AWWA’s Free Water Audit Software as the data collection tool. Along with the annual water audit, utilities distributing more than 100,000 gallons per day must have a systematic program to monitor and control leakage. Components of the program include periodic surveys, recommendations to monitor and control leakage, and scheduling for implementing the recommendations. Programs are subject to review by the utility’s state agency and must be updated a minimum of every three years.
The requirements may seem rigid, but considering the neglected condition of so much of America’s infrastructure, they are long overdue, and in the case of one DRBC member, New York, the amount of water that could have been saved (15–35 million gallons per day) is staggering. The losses continue to occur in sections of the Delaware Aqueduct, a water tunnel that delivers over 50% of the total drinking water to New York City daily. Some of the leaks can be repaired in the tunnel, but others require constructing a bypass tunnel around the leaking segment. At a cost of $1.5 billion, the price tag for the repairs is almost as staggering as the losses. But wait—that doesn’t include the losses from the millions of gallons that leaked out of the system.


