It has often been said that without water there would be no life. However, the presence of water is only one factor in the equation. It is not water alone that guarantees the presence of life; to sustain life the condition of that water must fall within a very specific range. Although life can be resilient—in the sense that for virtually any condition that can be imagined, some type of organism will thrive there—many forms of life are very sensitive, occupying one particular, narrowly bounded niche. Many of the specific organisms upon which society relies as part of the food chain or to sustain the habitability of the planet have a particularly narrow and specialized range of conditions under which they can thrive and propagate. Minor changes in salinity or temperature, for example, can drive fish like trout or salmon from a stream. And human activity can play a dramatic role in affecting these conditions.
A Microcosm With a Difference
“Millstone Watershed is like a microcosm of New Jersey,” says Erin Stretz, assistant director of science and stewardship at Stony Brook-Millstone Watershed Association (SBMWA). The watershed has variations in terrain; the northwest side of Route 1 is a high-gradient Piedmont with an almost mountainous topography, and to the southeast lies a coastal plain “that is a little more muddy and sandy.” It also has many types of land uses, from the urbanized landscapes bordering Brunswick and Trenton, to farmland.
The watershed has another land use, however, that Stretz says could be considered unusual for the state. “When people think of New Jersey, they don’t think ‘nature reserve,’ but we’re lucky enough to have a few of those features in our watershed.”
Stretz says that it was insightful of area residents witnessing the unbridled growth and development to begin to protect the environment by donating land to the Stony Brook-Millstone Watershed Reserve. The reserve now comprises about 1,000 acres of land, donated and amassed by area residents since 1949. It is managed by the SBMWA, with the goals of protecting habitat and conserving the land.
The SBMWA encourages and promotes a watershed education group serving residents from preschoolers to senior citizens. The association’s activities include partnership in the River-Friendly Business Certification Program, which encourages schools, businesses, golf courses, and residents to adopt practices that respect the ecology. During 10 weeks during the summer, the SBMWA sends out a team to conduct bacterial monitoring, collecting samples to be analyzed in the lab for E. coli and total coliform. A biological team collects macroinvertebrate samples three times a year, which they identify to family level. The StreamWatch program, underway since 1992, supports volunteer activities throughout the watershed to go out once a month to conduct chemical testing and to take readings of temperature, dissolved oxygen, pH, turbidity, nitrates, and phosphate.
The program relies on a variety of volunteers, including a retired physicist, a ninth-grade girl, and a 90-year-old retiree. Stretz notes, “We’ve been using LaMotte test kits for 25 years. We’re in a transition stage, trying to make the most efficient use of our lab at our new facility. We’ll be purchasing a mass spectrometer in the future.”
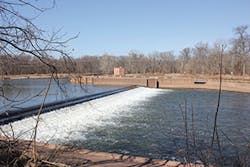
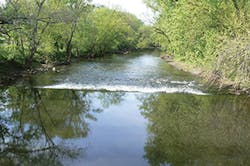
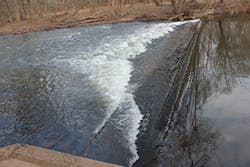
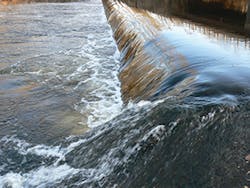
Farm weir with fish ladder
A Sparkling Future
“We use all of these assessments and tools to present a clear picture of the water quality in our area,” says Stretz. She notes that the water quality has changed dramatically over the region’s history. According to legend, when the first of the English colonists and explorers arrived in the region, the river was so densely populated with American shad that it reflected a sparkling silvery metallic tone from the massive schools of fish swimming upstream to spawn.
Now, she says, over the span of a summer, “you could count the number of migrating fish on your fingers.” Stretz believes what happened to the fish is not a complete mystery. Starting in the 1700s, settlers began building dams on the waterway to power mills and manage water supplies. “The dams are small, but high enough to disrupt fish passage,” causing the number of fish to plummet. But she says there may be a prospect for bringing the fish back: “Six years ago we were introduced to the opportunity to remove some of these low head dams.” Removal of the Weston Causeway dam, the first phase of the removal project, is scheduled for August.
A few years into its pre-removal study, the SBMWA is in the process of collecting ambient-water-quality data in the vicinity of the dams under consideration for removal. In each case, she says, “We’re hoping to see that dam removal has a positive impact on stream health. But the only way we can actually know that is to collect the data.”
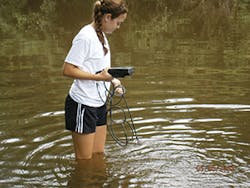
She says, “We have a YSI Pro2030. It’s a very rugged meter, which is nice, because I’m kind of rough on them. It measures dissolved oxygen, conductivity, salinity, total suspended solids, and temperature.”
Stretz believes the meter will come in handy gathering data for the dam removal project, and she appreciates having access to multiprobe functionality. “I had another job in Connecticut where you would have to replace the probes depending on what you would want to look at. What a pain that was compared to this. With the YSI, you calibrate it before you leave. We calibrate it for conductivity every two weeks. We calibrate for dissolved oxygen every morning that we’re using it, and you’re good to go the rest of the day. We’ve had this meter since 2012 and I’ve only replaced the batteries once. It’s extremely reliable.”
It can record changes in the parameters that determine suitability of the habitat for fish. Stretz explains that by impounding water, the dams have a much broader impact than merely interfering with fish passage. “When you put in a dam, you create a lake-like effect; turbidity will be increased.”
In addition, the banks widen and sedimentation increases. “There is a one-to-one correlation between dams and increased water temperatures.
As soon as you block the water in a river, the temperature of the water behind the impoundment will increase compared to the waters downstream of the dam. Many aquatic species are very dependent on a specific temperature range, especially in the summertime. When the sun is beaming down on this water it can get up to 30 degrees Celsius, which is very hot for these species.”
She says, “A lot of the parameters we’re looking at correspond to the requirements of the fish species we’re targeting, which include American shad, American eel gizzard shad—anything that needs that needs to travel up and down the stream, freshwater to ocean.”
By taking samples 200 feet upstream of the dam within the impoundment and additional samples representing more natural conditions a mile farther upstream from those, as a comparison, Stretz has observed the detrimental effects expected from the impoundment, including increased temperatures, increased turbidity, and loss of habitat. “Hopefully by removing the dam we’ll see that turbidity will be reduced upstream of the dam, temperature will be reduced upstream of the dam, and the habitat of that impoundment will return to a natural free-flowing river.”
The Probe That Launched a Thousand Paddlers
Members of the Georgia River Network (GRN), a statewide nonprofit organization focused on protecting Georgia’s waterways, believes effective river stewardship starts with connecting citizens to the state’s rivers by providing both fun and educational activities. Harold Harbert, outreach manager for the Georgia Environmental Protection Division (EPD) Watershed Protection Branch, who works closely with the GRN, notes, “A lot of what Georgia River Network does in terms of water-quality monitoring is low technology,” but they do it in large quantities. GRN compiles data from 400 active groups made up of 3,000 participants in North Carolina, South Carolina, Florida, and Tennessee, in addition to Georgia.
He says that for most of the monitoring work, the primary tool has been the Lamotte Field Test Kit, “a very practical technology for most groups who monitor just two or three sites.” For bigger projects, GRN offers volunteer groups access to its fleet of six multiprobe meters from ThermoFisher Scientific, making them available on loan to watershed groups on an as-needed basis.
“They’ve been happy with the ThermoFisher Scientific Orion Star A329 meters,” he says, which were purchased on a recommendation from a watershed group in North Carolina. “We were looking for something less expensive than what the regulatory side had been using.”
Harbert believes multiprobe meters have a track record of ease of use and reliability. “We’ve changed the batteries once in three years; the directions are just a couple of pages. It’s a multiple meter and covers all of the parameters that we encourage our volunteer groups to monitor.”
Ease of use makes a tremendous difference, he says. “When you work with the general public, you find people with all levels of skill. It’s a very user-friendly interface. We’ve done training workshops with retired citizens and semi-professionals and the response has been very similar from both—very easy to use.”
In June 2006, Harbert says, Georgia River Network took a big gamble and “disregarded everyone’s advice,” taking 300 people on a paddling trip. They were gone for a week, navigating nearly 100 miles of the state’s waterways aboard an assortment of canoes and kayaks. Since that first trip, GRN has organized and sponsored similar annual weeklong paddling tours up and down Georgia’s rivers, covering 100 or more miles of stream reaches every year. It’s the largest weeklong river trip of its kind in the nation. Harbert says water-quality monitoring is an integral part of every adventure, and he takes along the Orion meter to facilitate accurate measurements.
He says the monitoring exercises always reveal a few surprises, the unwelcome kind being indications of leaking septic systems or broken sewage lines affecting the rivers, “but discovering the diversity of different types of aquatic ecosystems also makes it really fun.”
Although the meters provide a means for recording and uploading data electronically, Harbert prefers hand recording. Eventually all of the data gathered by staff and volunteers are entered into an online database, which in 2016 included 7,000 monitoring events.
“We found the probes are pretty handy when you are going to hit three to five spots per day,” says Harbert. Over the years, GRN has gathered many data sets. He explains that GRN acts as a passive source of information on river water quality, emphasizing, “We’re not promoting the use of the data, but we know that regulators have used it.”
With half a dozen Orion Star multiprobe meters in stock, Harbert says, “At any given time almost all of them are out on loan.” He adds that watershed groups and partners are “very appreciative of receiving a product like this to work with.”
And he applauds ThermoFisher Scientific for being supportive from the start. “They sent a field scientist out to meet with us and gave us a thorough overview of how to use their product, describing all of its capabilities and maintenance. They’ve been pretty responsive overall.”
Harbert says, “One of the neat things about the paddling trip is that we’ve been able to learn about the incredible diversity of the different watersheds in the state.”
A Quality of Soil
Understanding the quality of the land is central to success in farming. Shalamar Armstrong, assistant professor of agronomy at Purdue University in Indiana, explains that to provide a suitable environment for crops, about 50% of the volume of farm soil should be void. He says that in a typical, naturally well-drained field, 25% of the void volume would be filled by air, and the other 25% would be occupied by water. The air in the voids is essential to give the root zone access to oxygen needed to sustain plant growth. In poorly drained soils, water pushes the air from the voids, which fill up entirely with water. This drowns the root zone and impedes the plants’ development and growth.
According to Armstrong, a large proportion of the farm fields in the region of West Lafayette, IN, and throughout much of the Mississippi Valley often have such poor drainage that farmers have resorted to installing artificial drainage tiles to hustle excess water away from the root zone. These tiles involve tubing embedded a few feet below the surface of the field, capturing water as it percolates down through the soil and conveying it away from the fields and into drainage ditches. From there it can be directed to nearby streams.
A volunteer using the YSI Pro2030 meter in the Millstone River
Long-Distance Impact
However, Armstrong notes, solving the problem of drainage creates a new one. The water draining so quickly and efficiently from the field also carries away fertilizers and nutrients applied to nurture the crops. Nutrients such as nitrogen, once dissolved, are virtually impossible to remove from the water. The nutrients accumulate in receiving waters, in this case the Mississippi Delta and the Gulf of Mexico. Nitrogen-laden water drained by the tiles throughout the Midwest contributes to massive algae blooms in the Gulf of Mexico. When the algae die, they are decomposed by bacteria that draw heavily on oxygen in the water, eventually leaving large swaths of the Gulf in an anoxic state. Armstrong says there is a direct connection between what happens on the farm fields of the Mississippi Valley and the anoxic dead zones that appear every year in the Gulf of Mexico.
Nutrient loss through tile drainage has economic consequences on the farm too, he notes. Fertilizer that washes away can be considered a wasted investment, neither increasing yields nor reducing labor costs for farmers.
Experts have long suspected that the problem of nutrient loss is exacerbated by the adherence to a practice, common among farmers in the Mississippi Valley, of applying fertilizers in the fall, a time when they are least likely to be taken up by growing vegetation. Armstrong explains the rationale behind the tradition of fall fertilizer application: “It’s convenient to apply it in the fall because when the spring comes around it’s there where it’s needed.”
In addition, he says, in many locations the soil holds less moisture in the fall, making it easier to operate the machinery needed to apply and spread the fertilizer. Finally, unlike in the spring season when farmers are competing for access to the manpower and machinery to get crops seeded during favorable weather, fall fertilizing can be handled at a measured pace, without pressures on labor and equipment. The downside to the practice is that the nutrients laying on top of fallow ground are susceptible to being washed through the soil and out from under the fields through the tiles, reducing the efficacy of the application and eventually contributing to nitrification of receiving waters.
Armstrong believed that a careful analysis of a few alternative fertilizing strategies might offer some new perspectives to help resolve the dilemma farmers faced over when to feed their crops. He chose automated samplers from Teledyne ISCO to drive the data collection.
Studying on the Farm
Researchers from Purdue University obtained the cooperation of a local farmer, who set aside 15 acres of cropland to test various fertilization strategies. Armstrong’s team demarcated the designated fields into 15 individual plots of 1.5 acres each, implementing on each separate plot one of several different farming practices. Armstrong sought to determine whether adjusting fertilizing schedules to the spring season and integrating cereal rye and daikon radish as cover crops during the fallow season could reduce the amount of nitrogen lost from tile-drained fields.
Five different treatment methods were replicated three times each, and a control plot was established where crops were simply rotated between corn and soy. Positioned at the ends of the tile drains to record the flow, the ISCO samplers were programmed to collect samples from drainage water during precipitation events. Triggered when flow thresholds were met, they would collect three samples per hour and a composite sample from each individually drained plot. Students then went out to the fields to pick up the samples to take them back to the lab to analyze them for nitrate and phosphorus.
Armstrong explains that the ISCO system, housed in a weatherproof box, is solar powered and equipped with a communication module that reports to the lab in real time such data as air temperature when the samples were collected, water temperature, flow rate, and the size of the sample collected. In addition, the system automatically self-reports any malfunctions, errors in the sample collection, or power interruptions. “It basically gives us an overview in real time of every variable that we are measuring.”
When called upon, Teledyne ISCO specialists provided sustained and detailed support, Armstrong says. “There were scenarios where we were not able to program the equipment exactly the way we wanted, or maybe we could program it but there was some kind of malfunction. Because everything is software driven, we were able to call ISCO and have them take over the program and, on our computer screen, troubleshoot in front of us. That assured us that the problem was going to get solved, and it showed us how to troubleshoot the problem. It’s educating us so that we don’t have to call them the next time.”
Armstrong says the study led to some interesting conclusions. Somewhat surprisingly, in the plots without cover crops there was virtually no difference between fall application and spring application in terms of the amount of nitrogen lost. However, he says, “We found that despite the timing of nitrogen application, whether spring or fall, when cover crops were added during fallow periods there was a huge reduction in the amount of nitrogen leaving the field. Cover crops were able to take up and sequester about 25% of the nitrogen the farmer was applying regardless of whether the nitrogen was applied during fall or spring.”
He says he would definitely use samplers from Teledyne ISCO for future studies. “We are, in the region, a model of how to facilitate this kind of research using the equipment. Based on our success, other scientists have begun to use similar equipment in order to measure water quality in the region.”
An Indication of Waste
What to make of evidence of fecal contamination presents a quandary for officials in many jurisdictions with aging sewer infrastructure. Baltimore, MD, finds itself with a sewer system now going into its second century of operation, and there is ample reason to believe that from time to time there will be evidence of decay just caused by the sheer aging of the system.
Often, the first sign of trouble is fecal contamination in creeks in the vicinity of damaged sewer lines. Eric Schott, assistant research professor at University of Maryland Center for Environmental Science, explains that there are two types of fecal contamination: “the kind you can do something about, and the kind you can’t.”
There is little that can be done about contamination from birds and wildlife. However, when it comes to contamination from human waste and pet waste, practices and policies can affect water quality. The important thing is being able to tell the difference. Determining the source of contamination not only can help target infrastructure repairs where they are most needed but also can help communities better understand their own connection to the waterways in their neighborhoods and what they can do to protect them.
Along with Wolf Pecher, assistant professor at University of Baltimore Division of Science, Information Arts and Technologies, Schott has been engaged in an EPA-funded study on the Jones Falls River in Baltimore to determine whether new techniques can help determine the difference between human waste discharged into the waterway by deteriorating sewage infrastructure and pet waste washed into the waterways from sidewalks, backyards, and curbsides.
Schott’s research team, trained and carefully outfitted with gloves and goggles to protect themselves from potentially contaminated water, collected stormwater samples in HDPE bottles from dry-weather flows at outfalls along the Jones Falls River. The samples were then filtered, and DNA was extracted from the filtrate.
Schott’s team used a quantitative polymerase chain reaction (qPCR) assay manufactured by Mo Bio, a Qiagen company. He notes that this type of assay is commonly used in environmental studies because it produces DNA that don’t carry PCR inhibitors, which, if present, could affect later analytical steps. The DNA was extracted from filtered samples using the PowerLyzer PowerSoil DNA isolation kit from Mo Bio, and genetic analysis was done using the TaqMan gene expression assay from ThermoFisher Scientific.
Clean Results Glean Useful Data
According to Schott, Mo Bio has a reputation for producing DNA extracts “that are clean and don’t inhibit the downstream enzyme reactions that are the PCR steps.” Both Mo Bio and TaqMan products are also popular in part because they have been approved by EPA as methods for doing genetic assays. “When we’re doing a study with EPA funding, we need to submit to EPA the protocol that we’re going to use, including the specifics on the reagents, and they review it.”
While in most cases fecal contaminates were genetically traceable to human waste, Schott says, “Using these methods, we were able to locate at least one instance where the fecal indicator bacteria were mostly associated with canine rather than human, so in that particular stormwater catchment, effort would be put into controlling dog waste rather than looking for a source from the sewage lines.”
He notes that this kind of information can “give the community the power to help clean up their waterway.”
Pecher adds, “There had been the feeling in the community that the city wasn’t doing enough. If you don’t know where the problem comes from you don’t know who to blame. Pointing out to the community that, yes, sewage is a problem, but there is also indication that dog waste is a problem helps because people can then really engage and contribute to the cleanup effort.”
From a broader perspective, Schott says, the study aimed to test the concept of genetically characterizing waste to trace its origin as a means to focus infrastructure repair. “We’re going to begin to do 10 samplings in the spring and summer to help identify and pinpoint infrastructure repairs. If you find fecal bacteria and you can verify using the genetic technique that it is human sourced, then you have confidence that looking for the source and conducting the repairs is a good use of money.”
Moving Toward Continuous Monitoring
Budget-strained government entities—as well as entities adopting a watershed-based stormwater permit approach—are taking a closer look at remote monitoring.
“We see a lot of stormwater agencies that are hard-pressed with human resources to go out and do the sampling,” notes Janice Hiller, vertical marketing manager for In-Situ. “The qualifying start events don’t always happen 9 a.m. to 5 p.m. Monday through Friday, so it’s challenging to staff to meet those qualified stormwater events.
“The data they get can be minimal and of poor quality to make decisions, and the cost of lab analysis can be an expensive proposition, even for traditional stormwater NPDES permits where they have to take a set number of samples from these qualified storm events.”
Hiller knows of one case in which the lab analysis costs were reaching $40,000 a year, not including the cost of human resources to capture the grab samples.
“We have had several customers who have worked with the US EPA in a collaborative process to shift the monitoring requirements for their MS4 permits and have gone to more of a continuous monitoring paradigm so they can reduce the number of sites they’re required to monitor in the urban watershed,” says Hiller.
Case in point: the Albuquerque Metropolitan Arroyo Flood Control Authority, which recently moved to a watershed-based stormwater permit. “They have about 12 agencies that work in a cooperative arrangement and share the cost of monitoring two locations within that watershed, so by sharing those costs, they’re able to upgrade those monitoring systems to continuous monitoring with real-time telemetry and cloud-based data management systems,” says Hiller.
“Now they’re getting a lot higher-quality data with which to make decisions and actually see what’s going on in real time. If the pH or something like that changes, they can see in real time that there may be an illicit discharge going on, as opposed to traditional grab sampling where you likely wouldn’t see those events happening. Continuous monitoring allows them to solve problems as opposed to just collecting extensive data.”
Field maintenance is one of the biggest costs of a monitoring system, Hiller points out. “When you look at a multi-parameter sonde, you’re limiting your weak link, which is going to be pH because—depending on the environment—it requires calibration every week or two weeks, which is typical,” she says. “You’ve cut the cost of a field team going out and pulling the sonde, cleaning it, and recalibrating the sensors—primarily it’s pH they’ve got to recalibrate because of the limitations of the current state of technology.”
The impact on long-term monitoring is that crews can wait months in contrast to weeks to do field maintenance, she adds.
To meet the growing demand for long-term remote monitoring, In-Situ offers the customizable Aqua TROLL 600 multi-parameter sonde, designed with a sub-2 inch passive and active antifouling system for all sensors, including conductivity; internal data logging; and a nine-month battery life.
“The anti-fouling system combined with the sensor performance is really shifting the paradigm of continuous long-term monitoring deployment in a watershed-based stormwater management program,” notes Hiller.
Its design enables it to provide long-term deployment in fresh and saltwater applications. The Aqua TROLL 600’s base sensor configuration includes EPA-approved optical RDO, pH/ORP, turbidity, conductivity, temperature, and pressure, with ammonium, chloride, and nitrate ISE nutrient sensors available.
The Aqua TROLL 600 is designed with a flat surface and an anti-fouling system that wipes all of the faces of the drift-resistant sensors, resulting in more accurate and robust calibrations, says Hiller.
The Aqua TROLL 600 has calibration wizards. With an integrated Bluetooth, data can be collected and analyzed on mobile devices via the VuSitu mobile app for Android or Win-Situ 5 for PC or laptop.
Other features include an LCD status screen for visual indicators as well as an onboard micro SD card for data backup and download.
See the free In-Situ–sponsored webinar “The Evolution of Stormwater Monitoring Strategies” presented by DeWayne Smith, P.E., of Hydro Engineering Solutions, on June 7 or as an on-demand webcast at www.foresteruniversity.com.

