Click here to enlarge imageWhile conducting an extensive energy audit for a major Great Lakes pump user, the writer was presented with an application where a prior consultant had estimated cost savings of over $50,000 per year, by the addition of a variable speed drive to one of their pumps, using rough estimates. The user was in the process of acting on this recommendation. However, by field testing the pump, and conducting a more detailed analysis, the annual energy saving potential for the variable speed drive was found to be only $5,000, hardly worth doing.
I am sure that many pump users have been disappointed by the low level of energy savings actually achieved with some of their prior energy reduction programs. The only way to avoid these disappointments is to conduct a proper detailed analysis of the current system and the potential cost savings options, and to compare the differences.
A proper detailed pump system energy audit should include the following activities:
1. Identify the pumps and pumping systems that offer the greatest energy savings potential, with minimum effort, as detailed in the November 2007 column, and prioritize the most attractive systems.
2. Collect key detail information on these pump and systems, including:
a. The system flow rate objectives. What are the required future flow rates, not just the average, but also the minimum and the maximum. The average flow rate is needed to calculate the energy usage, while the maximum flow rate dictates the pump size. The minimum flow rate can be an issue with respect to the pump minimum allowable flow.
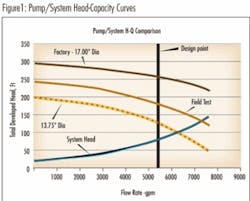
b. The actual system head vs. flow curve. Field tests may be required to establish the system curve. Once the installation is complete, the system head vs. flow curve can be obtained with three basic measurements. The total head at one specific flow rate, and the static system head. The total system head is comprised of the static head plus the friction head. The system static head is made up of the elevation head, plus any static pressure that the system must discharge into. The difference between the total system head and the static head is the system friction head. The friction head for other flow rates can be determined by using the square rule. The friction head varies as the square of the flow rate, so if the flow rate doubles, the friction head increases by a factor of four. The static head should then be added back to the various friction head values to establish the full system total head curve (figure 1).
c. What are the pressure drops across the various system valves and other major components at the average flow rate (or field test rate)? What is the pressure drop across the control valve when it is 100% open, and at the average system flow rate? Are any of these pressure drops excessive?
d. The as-new (pump manufacturer’s factory) pump head-capacity and power vs. capacity (flow rate) curves. This can later be used to determine if the pump performance has degraded over time from internal wear or corrosion.


