Using Wastewater Process Models to Predict Effluent Nitrogen
by Kevin Schmidt
Victor Valley Wastewater Reclamation Authority (VVWRA) in California recently used wastewater treatment process models to predict total nitrogen levels in the treated final effluent at its Regional Wastewater Reclamation Facility (RWWRF).
The VVWRA is a four-member Joint Power Authority first established in 1977. It receives wastewater from three cities: the City of Victorville, the City of Hesperia, and the town of Apple Valley. The fourth member is San Bernardino County which contributes flow from two of its County Service Areas: CSA 42-Oro Grande and CSA 64-Spring Valley Lake.
The VVWRA encompasses a service area of approximately 216 square miles. All sewer flow in this area is currently routed to its regional treatment plant which is operated by VVWRA under permit authority of the Lahontan Regional Water Quality Control Board. The current permit allows some of the treated wastewater to be discharged to the nearby Mojave River; while the remainder is discharged to percolation ponds.
Current average flow to the RWWRF is approximately 12 mgd and upgrades are underway to increase average capacity to 18 mgd. Approximately 50% of the VVWRA service area population is on septic tank systems. The periodic cleaning wastes from these tanks are hauled to the RWWRF and discharged by tanker trucks.
VVWRA has been operating on an NPDES permit (for discharge to the Mojave River) and WDR (for discharge to percolation ponds) that has no historic restrictions for ammonia, nitrate or total nitrogen.
In anticipation of future nitrogen restrictions, a previous expansion project (9.5 mgd), as well as the current expansion to 18 mgd incorporates anoxic zones of the influent into the aeration basins to accomplish denitrification and allows for enough MCRT to achieve full nitrification. Monthly discharge reports filed to the Lahontan Regional Water Quality Control Board (LRWQCB) have data on influent nitrate, ammonia and Total Keldjahl Nitrogen (TKN), and effluent data
Average permitted flow for the RWWRF is 12.5 mgd, and permit negotiations are ongoing to upgrade to the 18 mgd expansion capacity. As part of the new permitting, the LRWQCB has mandated that VVWRA prepare an Antidegradation Analysis that predicts plant nitrogen removals after completion of the expansion project and evaluates options for improving nitrogen removals with an optimum goal of keeping discharge total nitrogen below the groundwater background level of 1.0 mg/l.
Wastewater Process Model
A proprietary wastewater modeling software was used to predict effluent nitrogen concentrations after completion of the ongoing construction project and investigate options for lowering effluent nitrogen in a subsequent construction project. The modeling software uses a series of process equations with default parameter values, initial conditions and boundary conditions, compiled in a simulator and output through simulation scenarios.
The modeling work was implemented in five basic steps:
- Build the 18 mgd main process tanks.
- Input available load information from VVWRA as represented in the MDRs.
- Supplement MDR data with additional monitoring.
- Adjust the modeling parameters to approximate measured plant performance calibration.
- Run the model under post-18 mgd conditions and process enhancing alternatives to predict effluent total nitrogen levels.
Modeling Sensitivity Analysis
The model was successfully calibrated to closely approximate the existing plant’s performance. The key effluent parameter evaluated was nitrogen. Many model assumptions can influence nitrogen removal. A sensitivity analysis was conducted on three key model variables to determine the impact of changes from the model default settings.
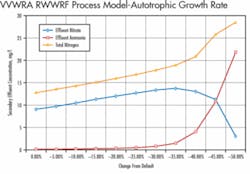
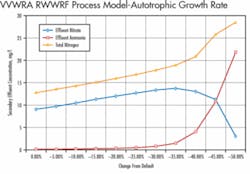
Figure 1.a shows the impact of decreasing wastewater temperature. As the temperature drops, the model predicts an increase in effluent concentrations of nitrate and ammonia, with nitrate increasing at a faster rate. At a low threshold temperature, nitrification nearly completely stops. This model result differs from field monitoring data at very low wintertime temperatures in the High Desert.
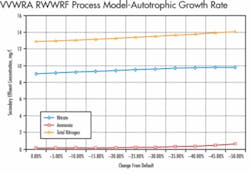
Figure 1.b shows the impact of lowering autotrophic growth rate. When this model assumption is changed and the wastewater temperature is left at the model default value, nitrogen removal only slightly increases, with the rate of increase about the same for nitrate and ammonia.
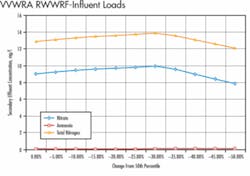
Figure 1.c shows the impact of increasing wastewater loadings to the plant. Default loadings for the previous sensitivity analyses were based on 50th percentile values of 15-day running averages for BOD, suspended solids and TKN. For this analysis, the wastewater temperature and autotrophic growth rate were left at the model default values. This analysis showed very little affect on effluent ammonia as influent loadings increase and an eventual decrease in effluent nitrate.
Conclusions
California Regional Water Quality Control Boards are moving toward the establishment of nitrogen discharge limitations that do not degrade existing background nitrate levels in the receiving water. This can impose very costly upgrades on wastewater treatment plants that need expansion and must obtain a new permit.
Wastewater process models are useful tools for determining existing plant nitrogen removal and for analysis of facilities that could be added to enhance nitrogen removal. Accurate influent characterization and model calibration are essential for reliable estimates of effluent quality. Particular attention should be paid to sidestream and recycle nitrogen loads, such as septic waste streams from cleaning trucks and belt filter press or centrifuge filtrate.
The model can predict a dramatic decrease in nitrification when wastewater temperature drops below a certain threshold value. Particular emphasis should be placed on field verification of plant performance as temperature drops. Remember that the temperature in the aeration basins will be slightly higher than the influent wastewater due to the heat of compression transferred from the aeration air blowers. The model has a number of temperature coefficients that can be adjusted to reflect actual plant performance as temperature drops.
The autotrophic growth rate should be left at its default value for most wastewater streams. Influent BOD, suspended solids and ammonia loads will vary over the course of the year. This variation can be due to seasonal changes in industrial discharges, or a higher proportion of restaurant use due to tourism and travel conditions. Care should be taken to assess influent characteristics at both average and 90th percentile loadings to avoid erroneous predictions as loading increases.
Finally caution should be exercised against over-optimistic interpretation of model results. Total effluent nitrogen levels of less than 10.0 mg/l are very difficult to consistently achieve. Lastly, the capital cost of construction and operation of denitrification and filtration facilities should not be underestimated and needs to be factored into future rate studies.
All model results should be verified or checked against measured field results. However, the models are an easy way of predicting the trend and/or impact of variables on the waste system.
About the Author:
Kevin Schmidt, P.E., is a Senior Associate and Senior Project Manager at RBF Consulting. With over 30 years of experience Schmidt is a seasoned civil and environmental engineer with an outstanding record of project success. He has provided planning, design engineering and construction management services for potable water, wastewater and reclaimed water projects that have included: sanitary sewers; sewer force mains; sewage lift stations; wastewater treatment plans; potable and reclaimed water distribution piping; potable water and reclaimed water booster stations; water storage tanks; and potable and reclaimed water treatment plants. Schmidt may be contacted at HYPERLINK “mailto:[email protected]” [email protected].


