GIS software monitors non-point coastal pollution
By Jim Baumann
Non-point pollution data models developed using Geographic Information System technology predicts coastal pollution as it enters a watershed on its way to the ocean.
Rachel Carson first published The Sea Around Us, her foreboding best selling book on the long-term effects of the continued pollution on oceans more than 50 years ago. However, with the huge increase in the world's population and the related increase in industrial and agricultural output, a significant amount of waste annually finds its way to oceans, making her words more poignant today than the era in which they were written.
More than 70% of the earth's surface is covered with water and more than 50% of the world's population lives within 50 miles of a coastline. The health and quality of life in oceans directly affects our own health and quality of life.
One major responsibility of the US National Oceanic and Atmospheric Administration (NOAA) is to protect coastal waters from excessive pollu-tion. NOAA does underwater mapping to determine coastal conditions, including the degree of salinity in a particular area, the location of specific marine habitats, and the extent of coastal pollution.
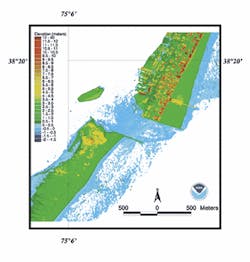
Recently, the NOAA developed an extension to ESRI's ArcView Spatial Analyst Geographic Information System (GIS) software called the LIDAR Data Handler, which helps monitor and potentially avert coastal pollution, including non-point pollution. The extension provides a number of options for the display and manipulation of gridded LIDAR data sets. ESRI is based in Redlands, California, USA.
Nonpoint pollution is widespread and considered difficult to track and prevent. Historically, most pollution control programs have dealt with single-source pollution, which generally originates from manufacturing activities and sewage treatment plants. Due to effective monitoring and management of these facilities, a greater percentage of coastal pollution is now considered non-point, which occurs when rainfall or irrigation washes over the land, picks up pollutants and carries them into watersheds and coastal waters.
Agricultural pollutants including fertilisers, pesticides and animal wastes are particularly detrimental non-point sources of pollution to the coastal zone. Light Detection and Ranging (LIDAR) is a remote sensing system used to collect topographic data. To make its measurements, a LIDAR sensor pulses a narrow, high frequency laser beam toward the earth through an opening in the bottom of an aircraft. The sensor records the time difference between the emission of the laser beam and the return of the reflected laser signal to the aircraft. LIDAR data can be viewed in a geographic information system (GIS) as a point, grid, or contour data set.
The NOAA developed non-point pollution data models using GIS technology with hydrologic modeling capabilities, which have been successful in predicting the concentration and direction of pollution as it enters a watershed on its way to the ocean. A grid format is used that includes mean pollutant concentrations for predefined land uses in related cells. The model maps the effect from rainfall of the hydrologic loading and runoff of each cell and traces the flow of pollutants as they move from cell to cell and enter the watershed system. The decay of pollutants can also be simulated and depends on the distance from each cell to the nearest downstream point in the river. With a digital terrain model of the watershed, a flow direction network can be generated and the downstream values of average annual pollutant loads can be determined.
Author's notes
Jim Baumann writes about international GIS-related topics for ESRI, located in Redlands, California, USA.


