Developing a Storm Drain Asset GIS for a Phase I MS4
by Terri Landrum
The North Texas Tollway Authority (NTTA) sought to develop a Geographic Information System (GIS) storm drain infrastructure network to support its MS4 compliance efforts and general system maintenance protocols. With the assistance of Jacobs Carter Burgess, NTTA's maintenance management consultant, the project was performed in two phases — Phase I Pilot and Phase II Completion.
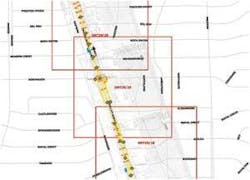
The purpose of the Phase I Pilot was to develop the GIS storm drain infrastructure network for two sections of the system and determine the level of effort involved. The tasks completed under the Phase I Pilot Project included several preliminary tasks such as scanning 2,250 sheets of storm drain construction plans, georeferencing the images to basemap data, creating an index grid, and locating major outfalls (see Fig. 1).
Figure 1. Example of index grid.
Geodatabase Data Model
The GIS was initially developed by creating a geodatabase data model that defined the assets and the attribute fields desired by NTTA for MS4 compliance purposes, mapping and populating the asset management system. The geodatabase data model visually defines all the data layers, data fields, specific types of assets (curb inlet, grate inlet, laterals, etc.), allowed values (domains) and linked tables in the storm drain geodatabase to provide a clear view of the elements that make up the GIS dataset.
Although defining the data requirements assisted with the development of the data model, an extensive study of the Authority's storm drain infrastructure was necessary to design and tailor the model to their needs. Many of the fields are unique to the Authority's storm drain infrastructure because of the nature of their MS4 as well as their goal of using the GIS to populate the storm module of the asset management system.
Production Geodatabase
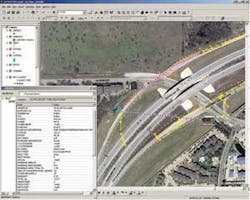
After the geodatabase was built, the storm drain asset graphics and attributes were populated from the georeferenced construction drawings (see Fig. 2). The GIS storm drain system that was developed as a result of the pilot project is managed and maintained inside the production geodatabase.
The production geodatabase also contains the geometric network, which assigns and manages storm drain network connectivity between the MS4 assets and flow direction. The locations of inlets, manholes, outfalls and infalls were determined by using a combination of digital orthophotography and the georeferenced Plan & Profile sheets. Building the geometric network and using the network validation tools was a productive way to check that all the linear assets were connected to a point asset at each end and that there was a continuous flow throughout the MS4 network.
Geometric Network
NTTA also wanted to be able to determine flow direction and trace flow throughout the storm drain system. The geometric network was built to facilitate connectivity between assets and automatically determine flow direction. In the geometric network, a set of lines and points, along with rules that define the relationships between the lines and points, are used to represent and model the behavior of a network in the real world. Each line must be connected to another line at a point and each point must be snapped to the end of a line.
The combination of line/point/line/point is the foundation for the geometric network. Since the GIS storm drain geodatabase was built using this configuration, the geometric network was constructed to model the flow of water anywhere in the network. Maintaining the geometric network ensures that when new storm drain asset graphics are added to the geodatabase they will be snapped to existing graphics properly and digitized in the direction of flow.
Field Verification
Since NTTA does not have as-built drawings for much of their system, the locations of approximately 30% of the asset graphics were field-verified using GPS technology. Due to the nature of the Authority's MS4, the logistics of field verification were carefully and thoroughly planned to efficiently collect field data and minimize travel and collection time overhead.
By first developing the storm drain asset graphics for the existing NTTA roadway system from the georeferenced plans, sections of the storm drain system that are missing and/or inconsistent with what appears in the digital orthophotography can be identified for the whole system.
A field was added to the geodatabase to denote that a storm drain asset needed to be field-verified. As the GIS Technician populated the production geodatabase from the georeferenced plans, the field was flagged for storm drain assets that were hand drawn on the plans or did not match what appeared to exist in the digital orthophotography.
Since the field verification effort only involved verifying the location and visible attributes of the storm drain asset, no attributes that required accessing the storm drain asset or measuring were collected or verified. Storm drain assets that were difficult to reach or inaccessible without traffic control were collected using the Contour XLRic Bluetooth laser, which allowed the GPS Crew to stand in a convenient location and collect the point remotely. Using the laser and limiting the field verification effort to location and visible attributes significantly reduced the amount of time and expense required to complete the effort.
Figure 2. Example of storm drain inlet attributes.
Quality Assurance and Quality Control
Several QA/QC and scripting routines were written to provide standardization and consistency throughout the GIS database. Since the storm drain asset graphics and attributes were entered according to the procedures defined during the pilot, most of the typical errors were avoided. By using the Visual Basic scripts that automate storm drain attribute data entry, the potential for error was greatly reduced. The errors that did occur become more obvious because the records containing the errors were rejected by the scripts.
The geometric network was another built-in method to test for storm drain connectivity between assets and to confirm direction of flow. The storm drain network was reviewed to ensure that the pipeline graphics were digitized in the direction of flow and were snapped to an upstream/downstream asset at each end. All team members shared in the responsibility of performing QA/QC activities.
Test and Validate the Geodatabase
After the pilot was complete, the geodatabase was run through a series of queries, tests and network traces to ensure that it was complete and produced accurate analysis results. Numeric attribute values were reviewed to see if they were within an acceptable range. Fields containing null values were double-checked to make sure that the data entry was not overlooked. The QA/QC activities and constructing the geometric network resolved most of the issues and errors, but reviewing the geodatabase as a whole provided one more opportunity to ensure it met project expectations.
Phase II Completion
Phase II of the project is underway and currently has over 10,000 asset graphics including pipes, culverts, channels, ditches, manholes, inlets, outfalls and infalls. It is estimated that the system will eventually contain over 34,000 features.
Developing and populating the remaining sections, field verifying approximately 30% of the storm drain system and importing the attribute information in the asset management system are the services currently being provided in Phase II of the project. The procedures, techniques, automation routines, Visual Basic scripts and QA/QC activities that were successfully implemented in Phase I of the project are being utilized and perfected in Phase II. The project is estimated to be completed in early 2009.
Summary
The North Texas Tollway Authority realized the need and value of having access to storm drain infrastructure asset information from within a GIS. They knew they needed a comprehensive database that contained accurate, detailed information. The investment they made into carefully defining the data requirements and geodatabase design provided a GIS that can support a number of scenarios, such as detecting and tracking spills; identifying and tagging pipes for condition assessment; processing work orders according to asset location as opposed to adjacent street or property; and tying dry weather illicit discharge inspections to each outfall and mapping them based on the results.
Integration with NTTA's asset management system as well as other applications will only extend the functionality of the GIS and make it an even more valuable investment.
About the Author:
Teri Landrum, GISP, is GIS Manager, Water Infrastructure, with Jacobs Carter Burgess (Forth Worth, TX).


