Creating a Comprehensive Stormwater Geodatabase
By Dave Coleman and Brian Anyzeski
The Village of Royal Palm Beach (“Village”) located in Palm Beach County, FL, understood the advantages of implementing a geographic information system (GIS) to manage stormwater infrastructure. The Village began the process by developing a detailed geodatabase of its stormwater system, with the data designed for use in ArcGIS, developed by Redlands, California-based ESRI. With the geodatabase, flooding concerns and pollutant discharge could be addressed to comply with the U.S. Environmental Protection Agency (EPA) National Pollutant Discharge Elimination System (NPDES) stormwater permitting program and also help the Village improve stormwater management resources for its citizens.
The project team, consisting of GIS specialists and professional engineers, attempted to review similar projects in Florida, but discovered that there was limited information available and that this type of project was more the exception than the rule. However, three related projects were reviewed, along with the ESRI data models. Although the three projects provided some good examples for overall learning, the project team decided it was necessary to design a comprehensive, customized geodatabase to meet the specific needs of the Village.
The project called for a stormwater system design and the conversion of stormwater data from scanned as-built record drawings to GIS format. The record drawings were then hyperlinked to the features in the GIS to provide one-click access to the complete system and detailed information. This article will describe the steps, successes, challenges, and future plans of the stormwater geodatabase.
Data Foundation
Multiple GIS base datasets were acquired to support the Village stormwater GIS project. Much of the data was acquired from Palm Beach County and state agencies, while other data was provided by the Village. The majority of the data was collected through interlocal agreements with the government agencies, providing a degree of leverage for the project. All base sets of GIS data were clipped using the Village boundary for performance optimization.
The base layers acquired included parcel ownership, Public Land Survey System, street centerlines, and subdivisions files. The parcel numbers were used in conjunction with other base layers to identify project locations within the Village.
Aerials were acquired from Palm Beach County. At project start-up, only 2002 and 2004 one-foot-resolution aerials were available. Later, in 2005, six-inch-resolution aerials became available, greatly increasing the accuracy of the data. With multiple years of aerials available, a time-series analysis could be conducted using some of the many tools available in ArcGIS, such as the swipe tool, to see change over time. Comparisons gave a visual perspective of new and deleted structures, developments, and road-widening projects.
The Village database of scanned TIFF drawings contained a mix of thousands of water and wastewater, irrigation, topographic survey, landscaping, and other detail sheets. Each file was opened and reviewed to locate all stormwater-related information, in particular paving, grading, and drainage drawings, which were recorded in a Microsoft Excel spreadsheet. The spreadsheet recorded items such as input status and the date that the drawing was entered into GIS, and was referred to throughout the project as a tracking tool.
Geodatabase Development
It was important to understand the complex stormwater system, and to use standard sources for the project. Florida Department of Transportation (FDOT) design standards were used, with emphasis on the coding conventions for ditch bottom inlets, inlet top types, and structure bottoms. In addition, the FDOT design standards allowed the project team to cross-check inlets, structure bottom types, manhole types, and possible riser combinations, providing a measure of standardization with the data.
The U.S. Foundry & Manufacturing Corp. Construction and Utilities Castings (USF) 3rd, 4th, and 5th editions were also used as references. The older editions were needed for the USF numbers called out on the older record drawings, since the USF numbers changed over the years for many of the structures. The USF was also used to look up coding conventions, such as grate types.
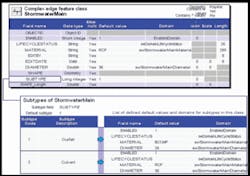
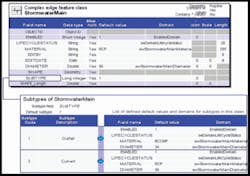
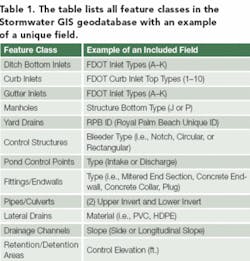
Next, detailed geodatabase structure was created using the Geodatabase Diagrammer Tool. The project team finalized the data fields, types, domains, and general framework for the optimum geodatabase. The final geodatabase included a detailed coordination of feature classes. Several fields were included for each feature class, and an example is given for each.
The data-conversion phase included the following steps:
- Load Data. The GIS base data and the empty geodatabase were loaded into ArcGIS.
- Set Parameters. For instance, the snapping tolerance was set to ensure proper connectivity.
- Determine Project Location. The “real-world” location of the record drawings was established using base GIS data, and a bookmark was created in the GIS for future reference to that location.
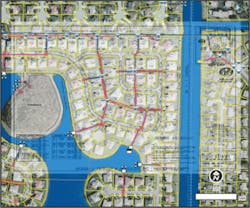
- Georeference Drawings. The TIFF was added to the data view and georeferenced to the parcel’s base layer and aerial photography, establishing a high level of accuracy. The 3-D effects toolbar was used to set a transparency level to the scanned record drawing, thus leaving the drawing, aerial, and other base GIS data visible.
- “Heads-up” Digitizing. The inlets were digitized first, followed by the storm mains and any fittings, endwalls, drainage channels, or retention/detention areas. Lines were digitized from the upper invert elevation to the lower invert elevation so that flow direction could be represented for modeling purposes.
- Attribute Addition. As the stormwater data was input, the attribute fields, such as diameter, and record drawing length (the GIS calculated length could vary slightly), were populated.
- Feature Organization. Features were assigned to the proper feature class. For example, if a grate was V-shaped, it was added to the “Gutter Inlet” feature class.
- Link Source Record Drawings. A hyperlink was established in the attribute table for each drawing. This detailed historical information would be available for the user to view through the GIS.
Wrapping Up
A geometric network was created with the final geodatabase. The network served as a component of the QA/QC method to help ensure that all appropriate edges were snapped, all lines were split where necessary, and all lines had endpoints. The network was created with the following features: pipes/culverts, ditch bottom inlets, curb inlets, gutter inlets, yard drains, control structures, and manholes.
A comprehensive QA/QC process included the use of a grid to keep track of the areas checked. The stormwater spatial layers were used with the parcels and aerial photography to identify locations and spatially show which areas were complete.
Tabular data, including the drawing sources, were checked for proper format and to verify that all fields were populated. Because of the massive amount of scanned drawings to link and the lengthy naming convention used, a program was developed to check the source filenames for accuracy. At times the Village’s filenames varied from their standard naming convention (i.e., excessive and unnecessary characters, spaces, and letters), and there were other errors in matches. A Microsoft Visual Basic program was created and Microsoft Access was used to detect matching errors between the source field and the archive database. The program returned a table of all unmatched records, and new strings were calculated.
By the end of the project, a handful of new subdivisions and commercial developments had been constructed. An update was completed to include this information along with some of the projects that were determined to have missing information. Going forward, CAD data standards requiring consultants to submit engineering information in a standard format will allow newer projects to be easily incorporated into the Village GIS.
There were some challenges for the project team. An effort was needed to make sure recent projects would override older projects in the same location. Another challenge was the variation in record-drawing sets among engineers. Legibility and missing information was also a problem in some cases. For instance, sometimes invert elevations were not clearly stated by pipe direction or not stated at all. Older drawings generally had more problems than newer drawings.
Conclusion
A variety of factors prompted the Village to implement a stormwater GIS, such as the desire to effectively inventory stormwater infrastructure and plan for future maintenance costs, and also to help with compliance of NPDES requirements. The development of the comprehensive geodatabase based on the FDOT design standards was an effective way to inventory the infrastructure. In the future, a hydrologic model will be generated with enough accuracy to model storm events on large and small scales. In the event of extreme weather, the stormwater GIS will help map critical infrastructure for quick response. In turn, the Village will be able to identify problematic infrastructure and high-water marks. Lastly, the Village will easily be able to provide as-built data to developers and utilities constructing facilities in areas containing stormwater data infrastructure. The system can be maintained and used for many studies and as a tool for decision-making in important projects for many years to come. uwm
About the Author:
Dave Coleman is an Associate Engineer at Boyle Engineering. He is a graduate of the University of Florida. After gaining experience with DuPont and Environmental and Safety Designs Inc., he earned a master’s degree in geography. He has participated in and managed a variety of GIS projects in several industries, including water, wastewater, stormwater, and local government. Brian Anyzeski is a GIS Specialist with Boyle Engineering. He received a master’s degree with a major in geography from Florida Atlantic University in 2004. He also received a bachelor’s degree with a major in geography and a GIS certificate from Florida Atlantic University in 2001. Anyzeski is experienced with database development in water, wastewater and stormwater, as well as facilities GIS for colleges and universities.
