Still Going Strong: Maintaining a Stormwater Utility in Arvada, Colorado
By Jeff Liedtke and Sandra McDonald
Numerous municipalities, water management districts and local government jurisdictions have established stormwater utilities to fund activities associated with compliance with National Pollution Discharge Elimination System (NPDES) requirements under Municipal Separate Storm Sewer System (MS4) permits. Many cities raise funds for stormwater management by billing property owners according to parcel size or land use, but this approach is not always deemed fair.
It is reasonable that increased impervious area is directly proportional to increased runoff and the need for stormwater management operations. For the city of Arvada in the Denver metro area of Colorado, a citizen stakeholder group decided that the most accurate, consistent and fair billing method would be to base the utility fee on the amount of impervious area within each parcel with everyone paying at the same rate. Impervious features typically include manmade structures such as concrete, asphalt and building rooftops.
In 2000, the city of Arvada determined that it needed to raise $2 million annually to fund capital improvement projects for flood control and the programs required under their NPDES MS4 Stormwater Permit. Implementation of the stormwater utility fee required that each parcel be hand digitized and the resultant square footage of impervious area linked to the water and sewer utility billing system. A rate of $0.00112 per square foot of impervious area was calculated from the estimated 148.5 million square feet of impervious area for the city. The average monthly household payment was $3.51, a rate that was defensible, regionally competitive and kept the charge reasonable for those citizens with small homes and dirt driveways. In 2002, Arvada implemented the stormwater utility fee based on the amount of impervious area contained on all properties, including municipal, state, federal, nonprofits, residential and commercial sites.
In 2003, Arvada began implementation of its first NPDES MS4 Stormwater Permit and had the funding in place to construct a number of flood control projects. By 2008, the city was required to apply for a renewed NPDES MS4 Stormwater permit. Because the amount of impervious area changes as development occurs, Arvada took this opportunity to update the basis for the stormwater utility fee in the city, which posed several challenges and benefits summarized herein along with lessons learned.
Challenges and Methods
The method to generate and update the impervious area for the city of Arvada’s stormwater utility fee relied on four primary data sets managed in the city of Arvada’s Geographic Information System (GIS), including the city’s parcel database, existing impervious surface area layer, 2001 orthophotos and newly acquired orthorectified aerial imagery. The original impervious surface area maps were manually compiled in heads up digitizing mode from 2001 black and white orthophotographs. In the spring of 2006, natural color digital aerial imagery was collected under leaf-off conditions and subsequently orthorectified and delivered in late spring of 2007.
The steps for updating Arvada’s impervious area map and stormwater billing system comprised the following: change detection; impervious surface mapping; repositioning of new impervious surface features to register with Arvada’s parcel layer; and incorporation into the billing database.
Change Detection
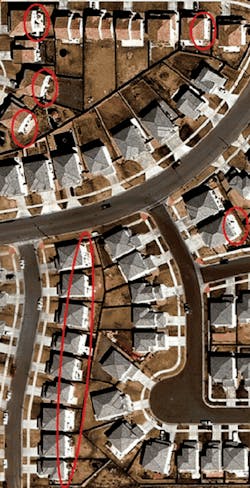
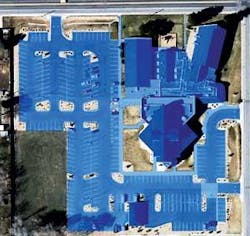
The first step was to identify the parcels affected by a significant increase in impervious surface area. A significant increase was calculated to be greater than 5% of the original hand-digitized impervious area map. An impervious surface map (ISM) was automatically derived from the 2006 color orthoimagery using advanced object-oriented image processing techniques. Both spectral and spatial characteristics were considered in order to achieve the most accurate results possible with automated image processing techniques. The ISM was then digitally compared with the 2001 impervious feature layer, and changes were detected and mapped using automated image processing techniques. This approach quickly identified the parcels exhibiting significant change in impervious surface area, and streamlined the updating efforts.
Some key challenges with the source datasets were overcome during the change detection operation, including different radial displacement between the two orthoimagery datasets, and misregistration between the 2001 and 2006 orthoimagery.
Radial displacement is ‘building lean’ caused by the camera view angle when the data was initially collected. As one moves away from the center of image, buildings will lean away from the center of the image, becoming more pronounced as you move further away from center. Building lean can both obscure thin impervious features close to buildings (e.g., sidewalks) and create false changes such as the sides of retaining walls and fences. Radial displacement is compounded when comparing two orthoimage datasets collected with different flight patterns, as buildings will often lean in different directions. This creates the potential for false changes since the sides of buildings are automatically identified as changes.
To address these issues, it was necessary to establish a change classification threshold based on spatial and spectral characteristics for ‘real’ change between the 2001 and 2006 orthoimagery. With this threshold in place, both parcel level change (e.g., new residential and commercial buildings) as well as sub-parcel change (e.g., new patios and building additions) were detected. Conversely, some features, such as thin sidewalks, were not classified as changes because they were either spectrally or spatially similar to the established thresholds rules. These small changes did not represent a significant portion of the parcel (i.e., much less than 5%) and were deemed acceptable variances that were not further pursued.
Finally, the parcel layer was compared to both the 2001 and 2006 orthoimagery and the derived impervious surface area maps. Significant misregistration issues were discovered between the impervious surface maps and the parcel layer due to the different map projection systems used in Arvada over time. However, since the objective in this step was simply to identify parcels affected by significant change in impervious surface area, not map the impervious surface areas, the misregistration issues were not addressed at this stage. Approximately 2,500 new parcels and 1,500 changed parcels were identified as requiring additional inspection in this step.
Impervious Surface Mapping
Once changed parcels were identified, impervious features on these parcels were manually digitized from the 2006 orthoimagery. All the impervious surfaces contained within a parcel were delineated, even when sub-parcel change was detected. For example, when a new patio was detected in a parcel that had already been mapped for impervious features, all the impervious surface features within the parcel were redigitized to account for the misregistration between the parcel data and orthoimagery. This assured the most accurate alignment possible between the 2001 impervious feature polygons and the newly generated 2006 impervious surface polygons. Approximately 4,125 parcels were redigitized by hand to develop the new impervious surface layer; these were then merged into Arvada’s existing 2001 layer to create an updated impervious feature layer.
null
Repositioning of New Impervious Surface Features
As previously stated, there was significant misalignment between Arvada’s parcel data and the orthoimagery datasets. This misalignment could result in serious errors in impervious surface area calculations on a parcel basis as it is not uncommon for parcel boundaries to bisect mapped impervious feature polygons. In order to address the misalignment and maintain the integrity of Arvada’s impervious feature layer, a copy of the manually digitized 2006 impervious surface layer was created, then all impervious surface feature polygons were manually realigned so that they were contained completely within their respective parcel boundaries.
Incorporation into the Billing Database
Once the repositioning was completed, the amount of impervious surface area per parcel was calculated and linked to Arvada’s existing parcel layer. From this layer, a spreadsheet was created with the new impervious areas that linked each parcel by their address, parcel ID number, and stormwater billing code. These links enabled the city of Arvada to update all stormwater charges in the city’s utility billing database with the new impervious surface feature areas to automatically compute the stormwater utility fee for each parcel.
Costs and Benefits
A significant change in impervious area was detected and mapped between 2001 and 2006 for the city of Arvada. Of the over 31,000 utility billing accounts, 4,126 parcels exhibited changes in impervious surface area greater than 5% and were updated. This accounted for an increase of 58 million square feet of impervious area in the city, resulting in the addition of more than $65,000 annually to the stormwater management fund. The cost of the impervious surface area update was $21,000, or about $4,250 per year over five years. The added revenue allowed the city to hire a full-time stormwater inspector to help better meet the needs of its constituents, permit requirements, and stormwater management activities.
Besides significantly increasing stormwater management funds, the updated impervious surface layer can be used as an input to more accurately model stormwater runoff. This helps to identify flood control and pollution abatement measures. When used with topographic and land use data, stormwater managers may use the information to determine from where stormwater originates, over what land uses it flows and what types of pollutants it may encounter, thereby helping to identify potential Best Management Practices for treatment of runoff before it enters surface waters.
Summary
Establishing a stormwater utility is expensive in terms of upfront cost and time to implement the management and billing infrastructure. However, once the utility is established, significant rewards are reaped downstream. Maintaining and updating the foundation data supporting the stormwater utility is relatively straightforward and much less expensive than the initial investment. Leveraging the initial hard work and upfront investment of establishing a stormwater utility can result in large benefits and return on investment over time, and has been shown to be very worthwhile.
Each stormwater utility is unique because it is designed to meet the needs of its constituents, budget, IT/GIS, physical and environmental conditions. Therefore, it is important to employ consultants with the expertise to tailor the project design to meet the multiple needs and objectives of the stormwater utility. Critical design reviews, proof-of-concept pilot studies, intermittent performance milestones and timely communication were all necessary to make appropriate adjustments throughout the project. Open dialog between the consultants and the city’s stormwater and IT/GIS management was essential to ensure a successful stormwater utility update for the city of Arvada.
Acknowledgements
The authors wish to thank and acknowledge eMap International and WorldVu consultants, and the city of Arvada project team, for their excellent work in implementing the updated stormwater billing system with minimal problems.
About the Authors:
Jeff Liedtke has created products and services serving the Geospatial Industry for more than 20 years. With degrees in remote sensing and environmental sciences, he is primarily interested in deriving actionable geospatial information to support decision management systems.
Sandra McDonald, Stormwater Administrator for the City of Arvada, managed the 2001 implementation and 2008 update to the city’s stormwater utility. She has over 20 years professional experience in the Denver Metro area environmental programs, working in federal, state and local capacities.


