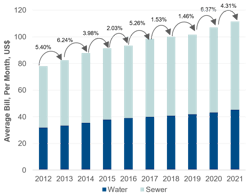
Water rates up 43% over last decade
Bluefield Research has recently published its latest annual benchmark study of residential water races across U.S. cities.
The new analysis shows water rate growth currently outpacing other household utility services (e.g., power, gas) at an average of 4.2 percent per year. As such, the combined water & wastewater bill for a typical U.S. household has swelled to 43.2 percent from 2012 to 2021, an indicator of the water sector’s growing financial burden.
Across the 50 largest metropolitan areas in the U.S., combined monthly water and wastewater bills for a typical U.S. household surpassed US$111.60 per month, based on average household consumption. Typically, wastewater makes up approximately 60 percent of the total bill while water services make up the remaining 40%.
Many water utilities are making efforts to balance affordability with the financial requirements to adequately operate treatment facilities and pipe networks. Amidst these annual increases, 29 of the 50 cities examined have maintained rate discounts for low-income households and the elderly, attempting to insulate the most vulnerable customers from rate increases.
“Our data indicates that water rates are growing at a faster clip than rates for other utilities services like electricity and natural gas, which, surprisingly, only average a 1% increase per year,” says Bluefield Research Director Erin Bonney Casey. “While water still only makes up 26% of consumers’ average household water utility bill, consumers are beginning to feel the impacts. At the same time, utilities and municipalities are beginning to see more unpaid bills, or non-revenue water.”
Utility revenues generated through water rates are used to fund ongoing operations and maintenance of systems. Regional variations in water & wastewater rates illustrate the unique water management challenges faced by cities across the U.S. western utilities that frequently require infrastructure investments to secure new water supplies in the face of drought. In contrast, large water utilities in the Northeast implement higher bills in part due to the scale of operations and maintenance and the rising cost of operating aging water treatment and pipe networks.
Monthly combined household water & wastewater bills range from a low of US$46.35 in Memphis, Tennessee to a high of US$296.23 in San Francisco, California. The most significant water rate increases have been in response to specific capital investment needs. Baltimore, Maryland residents are subject to a fixed wastewater Bay Restoration Fund rate explicitly levied to support wastewater treatment plant upgrades. San Francisco, California has been steadily increasing rates to fund its US$4.8 billion Water System Improvement Plan.
“A common question presented to our team is the impact of drought on water rates,” says Ms. Bonney Casey, “but to date, there is little, if any, correlation demonstrated in our analysis. If anything, it is tied to infrastructure investment and operating costs rather than the availability of water.”
Multiple western utilities—including those in Los Angeles, California and Riverside, California—cite drought concerns and loss of revenue due to prolonged droughts as reasons for escalating rates. In these cases, utilities are not using price as a means of controlling water demand, but rather acknowledging that droughts can result in revenue declines at a time when operations are under the most strain.
SOURCE: Bluefield Research

